Northwest Philadelphia is running a two-speed housing market, with some homes selling within days while others wait for weeks or months. In October 2026, 124 homes closed across the nine communities I cover, per Bright MLS. The five Philadelphia zip codes put 71 homes under contract, down from 78 in September. This page is the standing summary of that market, refreshed with each monthly report.
The latest month: October 2026
A total of 124 homes closed in October across the nine communities, per Bright MLS, down from 128 in September once late-recorded sales are counted. One caution applies to everything below: a monthly median moves with the mix of what sold, and in a town with a handful of closings a single unusual sale can swing it.
| Community | Homes closed | Median sale price |
|---|---|---|
| Roxborough | 41 | $389,000 |
| Mt. Airy | 22 | $448,250 |
| Glenside | 20 | $500,850 |
| Chestnut Hill | 16 | $757,500 |
| East Falls | 9 | $385,000 |
| Manayunk | 8 | $280,000 |
| Flourtown | 5 | $662,500 |
| Wyndmoor | 2 | Two sales |
| Oreland | 1 | One sale |
Roxborough did the volume again, with 41 closings at a $389,000 median, close to its 12-month median of $396,250. Chestnut Hill had its busiest month of the past year, with 16 closings. Glenside's median jumped to $500,850, largely because September had eight sales below $400,000 and October had none. Manayunk's $280,000 ties February for its lowest of the past year, on only eight sales. Wyndmoor's two sales, at $580,000 and $833,000, and Oreland's one, at $455,000, are too few for a median.
Supply stayed high. The five Philadelphia zip codes ended October with 333 homes for sale, the same as September and the highest month-end count of the past 12 months. New contracts slipped in October, the first full month with mortgage rates above 7 percent, though three of the five zip codes went up and the decline came from Chestnut Hill and Manayunk.
The full write-up of the month is the October report, which has the detail on pace, supply and the pending pipeline.
Mortgage rates and the Fed
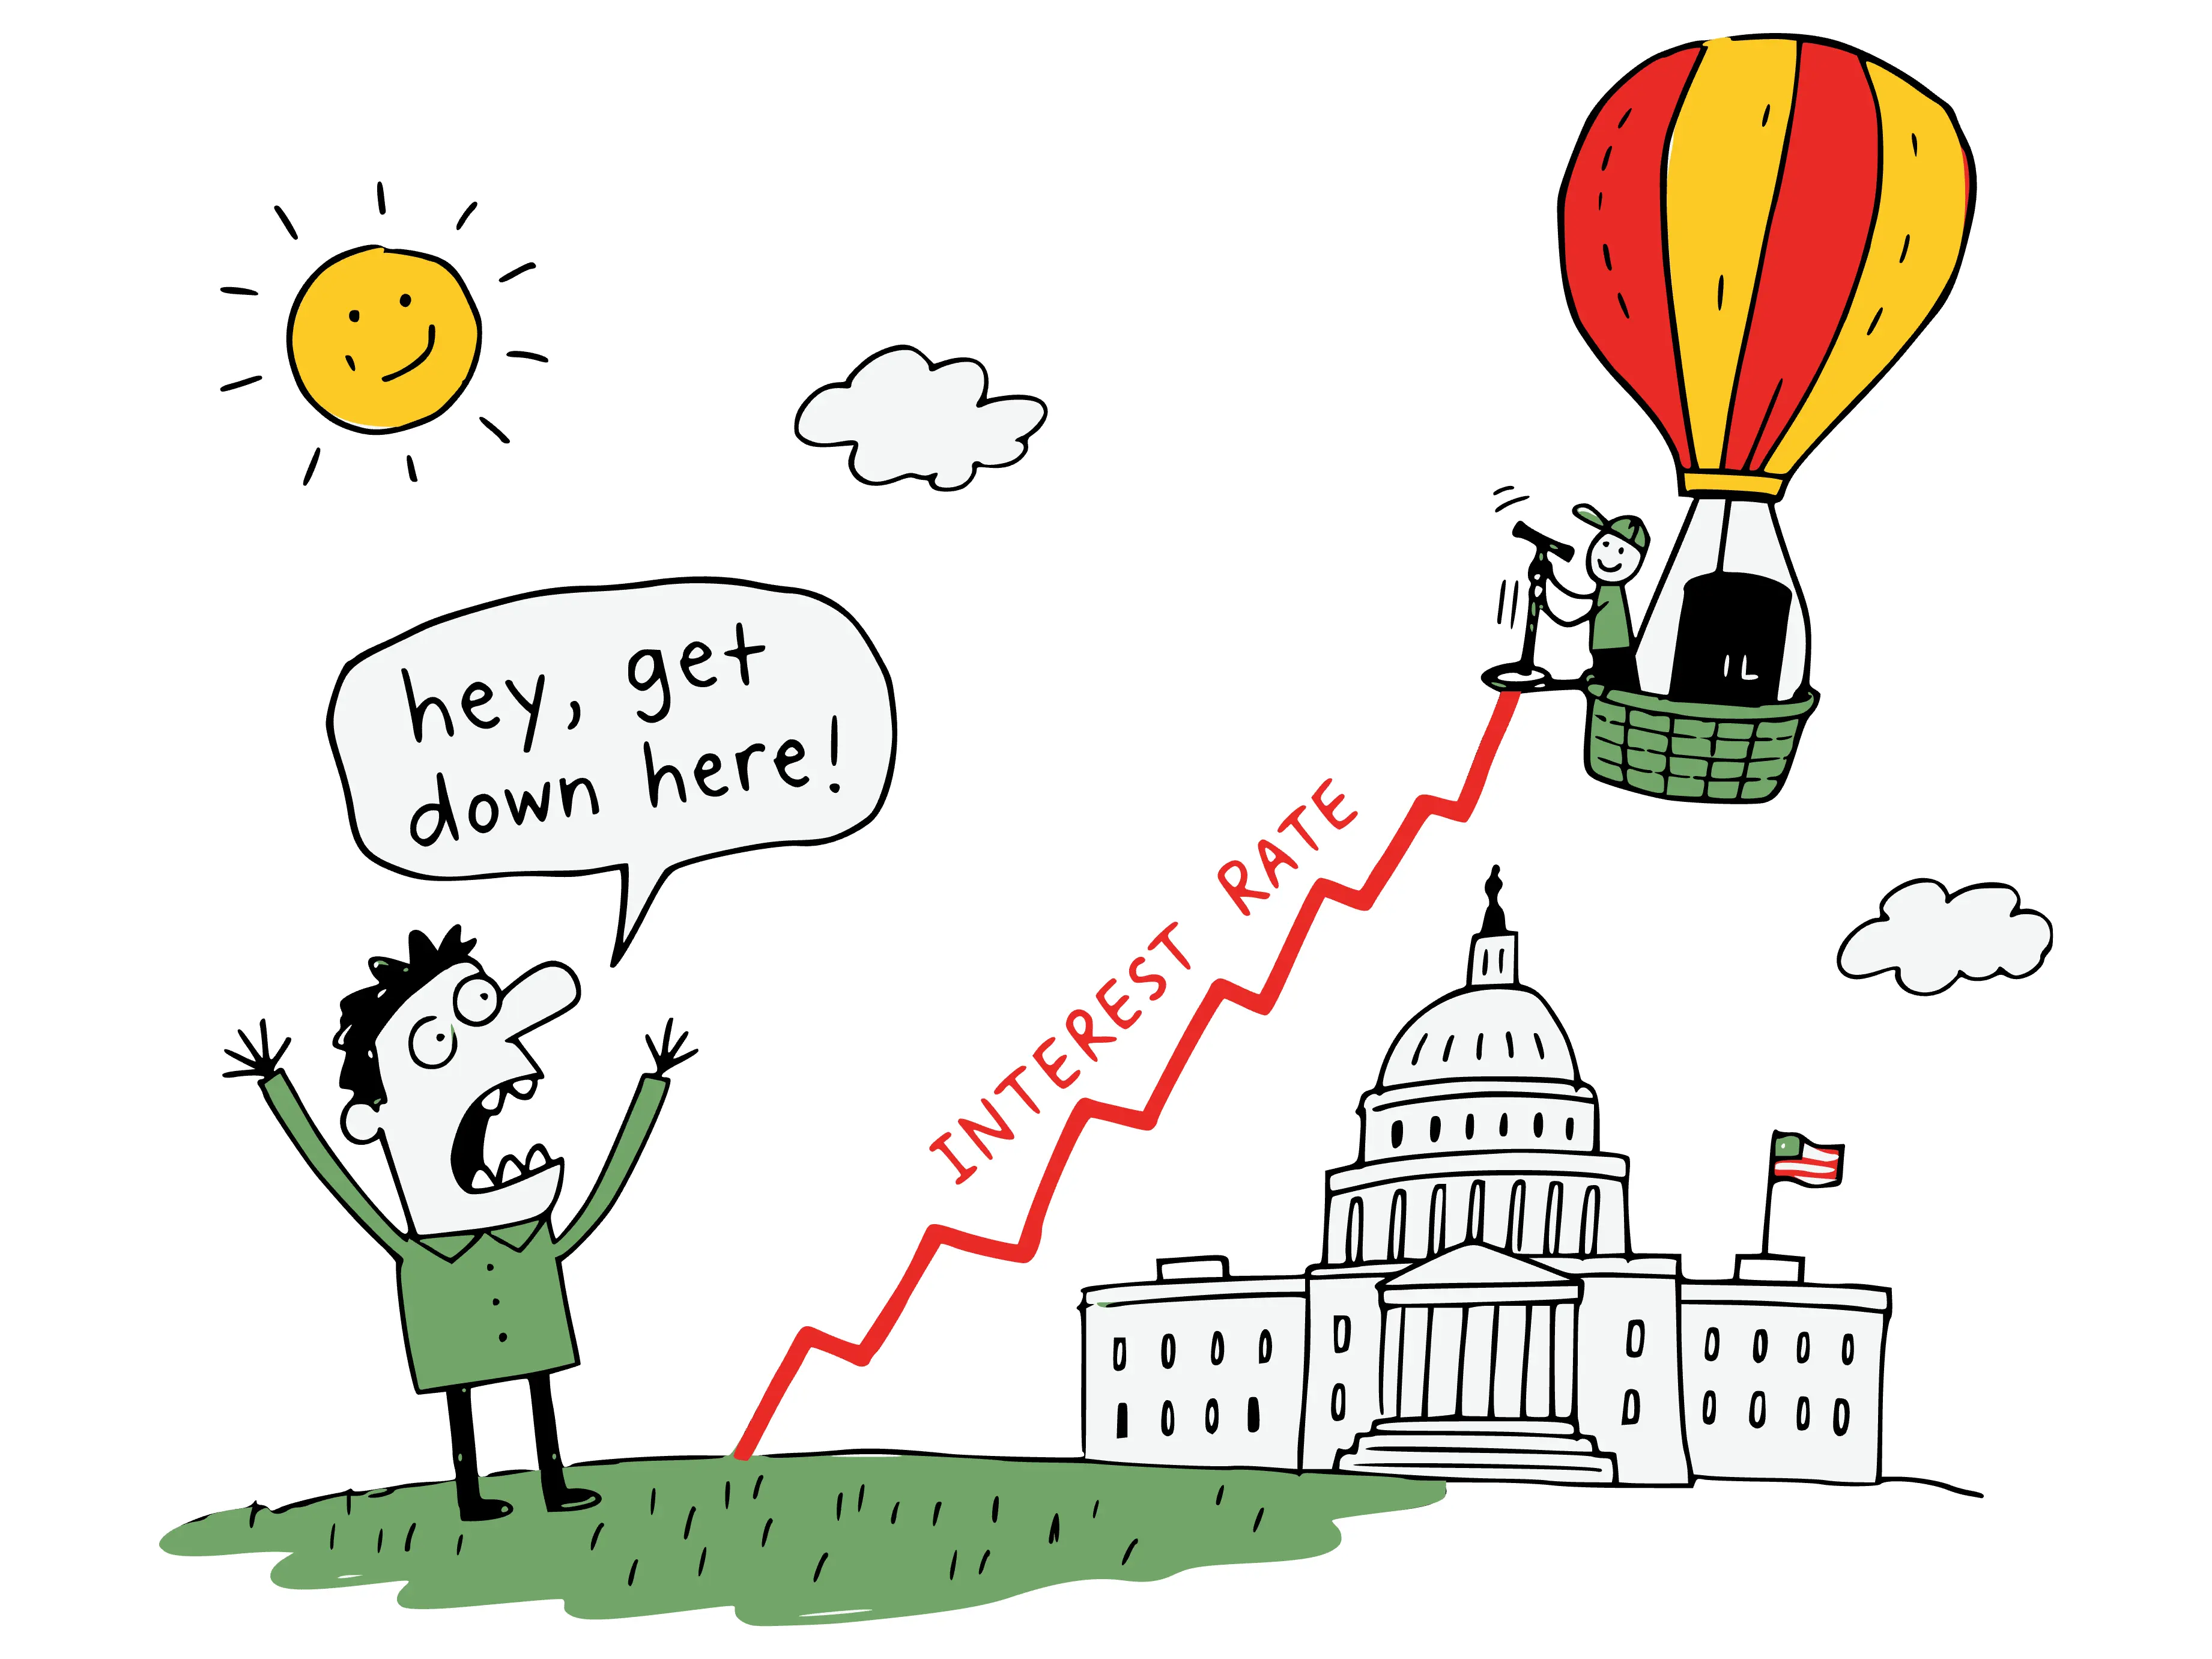
The Federal Reserve held its benchmark rate at 3.75 to 4 percent on October 28, six weeks after raising it a quarter point, according to its statement. Markets had expected the hold, so mortgage rates barely moved on the news. Freddie Mac's weekly survey put the 30-year fixed at 7.24 percent on October 29, down from a peak of 7.40 earlier in the month, and a year earlier it read 6.17. On a $400,000 loan, that's $284 a month more in principal and interest than a year ago.
Mortgage rates follow the bond market more than the Fed, because a 30-year mortgage tends to track the 10-year Treasury yield, and I wrote a full breakdown of how that works with five years of rate data charted. The next Fed meeting is December 8 and 9, and the October report covers what markets were expecting from it.
The year so far
Two numbers frame 2026 to date. The nine communities closed 435 sales in the second quarter, and half of them went under contract within eight days of listing, per Bright MLS. At the same time, the five Philadelphia zip codes ended June with 328 active listings, about 18 percent more than a year earlier, and they ended October with 333, about 7 percent more than a year earlier. So some homes are selling quickly while more of them wait, and I wrote about that split at length in the post on the market agents keep calling weird.
Bright MLS's Q2 2026 Industry Watch report puts county-level context under those numbers. Montgomery County's median sale price was $495,000 on 1.8 months of supply, with sellers collecting 101 percent of original asking price on average. Philadelphia County's median was $300,000 on 4.3 months of supply, with sellers averaging 96.3 percent of original ask. Within the communities here, Oreland's 19075 collected 105.6 percent of original list in the second quarter, Glenside's 19038 ran 102.7 percent and Chestnut Hill's 19118 came in at 103.5 percent.
The reports behind this page
Each month gets a full report with charts, the pending pipeline and neighborhood-by-neighborhood detail, and each quarter gets a deeper review. All of them live in the Market Update archive. Start with the October 2026 update and the Q2 2026 quarterly report. The dated posts stay put as the permanent record; this page moves with the market.
These numbers describe nine markets at once, so if you want them run for one street or one price range, reach out. And when the question turns from the market to your own move, my services page covers the buying side and the selling side.
Henry is a Philadelphia-based REALTOR® serving buyers and sellers in Northwest Philadelphia and Montgomery County, PA. Questions? Get in touch.
Based on information from Bright MLS for 10/1/2026 through 10/31/2026; data is reliable but not guaranteed.
Frequently asked questions
How is the Northwest Philadelphia housing market right now?
New contracts slipped in October 2026 while the number of homes for sale stayed at a 12-month high. A total of 124 homes closed across the nine communities this page covers, per Bright MLS, down from 128 in September once late-recorded sales are counted. The five Philadelphia zip codes put 71 homes under contract, down from 78. They ended the month with 333 homes for sale, the same as September.
What is the median home price in Northwest Philadelphia?
There isn't a single number, because each community has its own market. In October 2026 the monthly medians ran from $280,000 in Manayunk to $757,500 in Chestnut Hill, per Bright MLS. East Falls was $385,000, and Flourtown was $662,500. Wyndmoor closed two sales and Oreland closed one, so neither has a median worth reading this month.
What areas does this page cover?
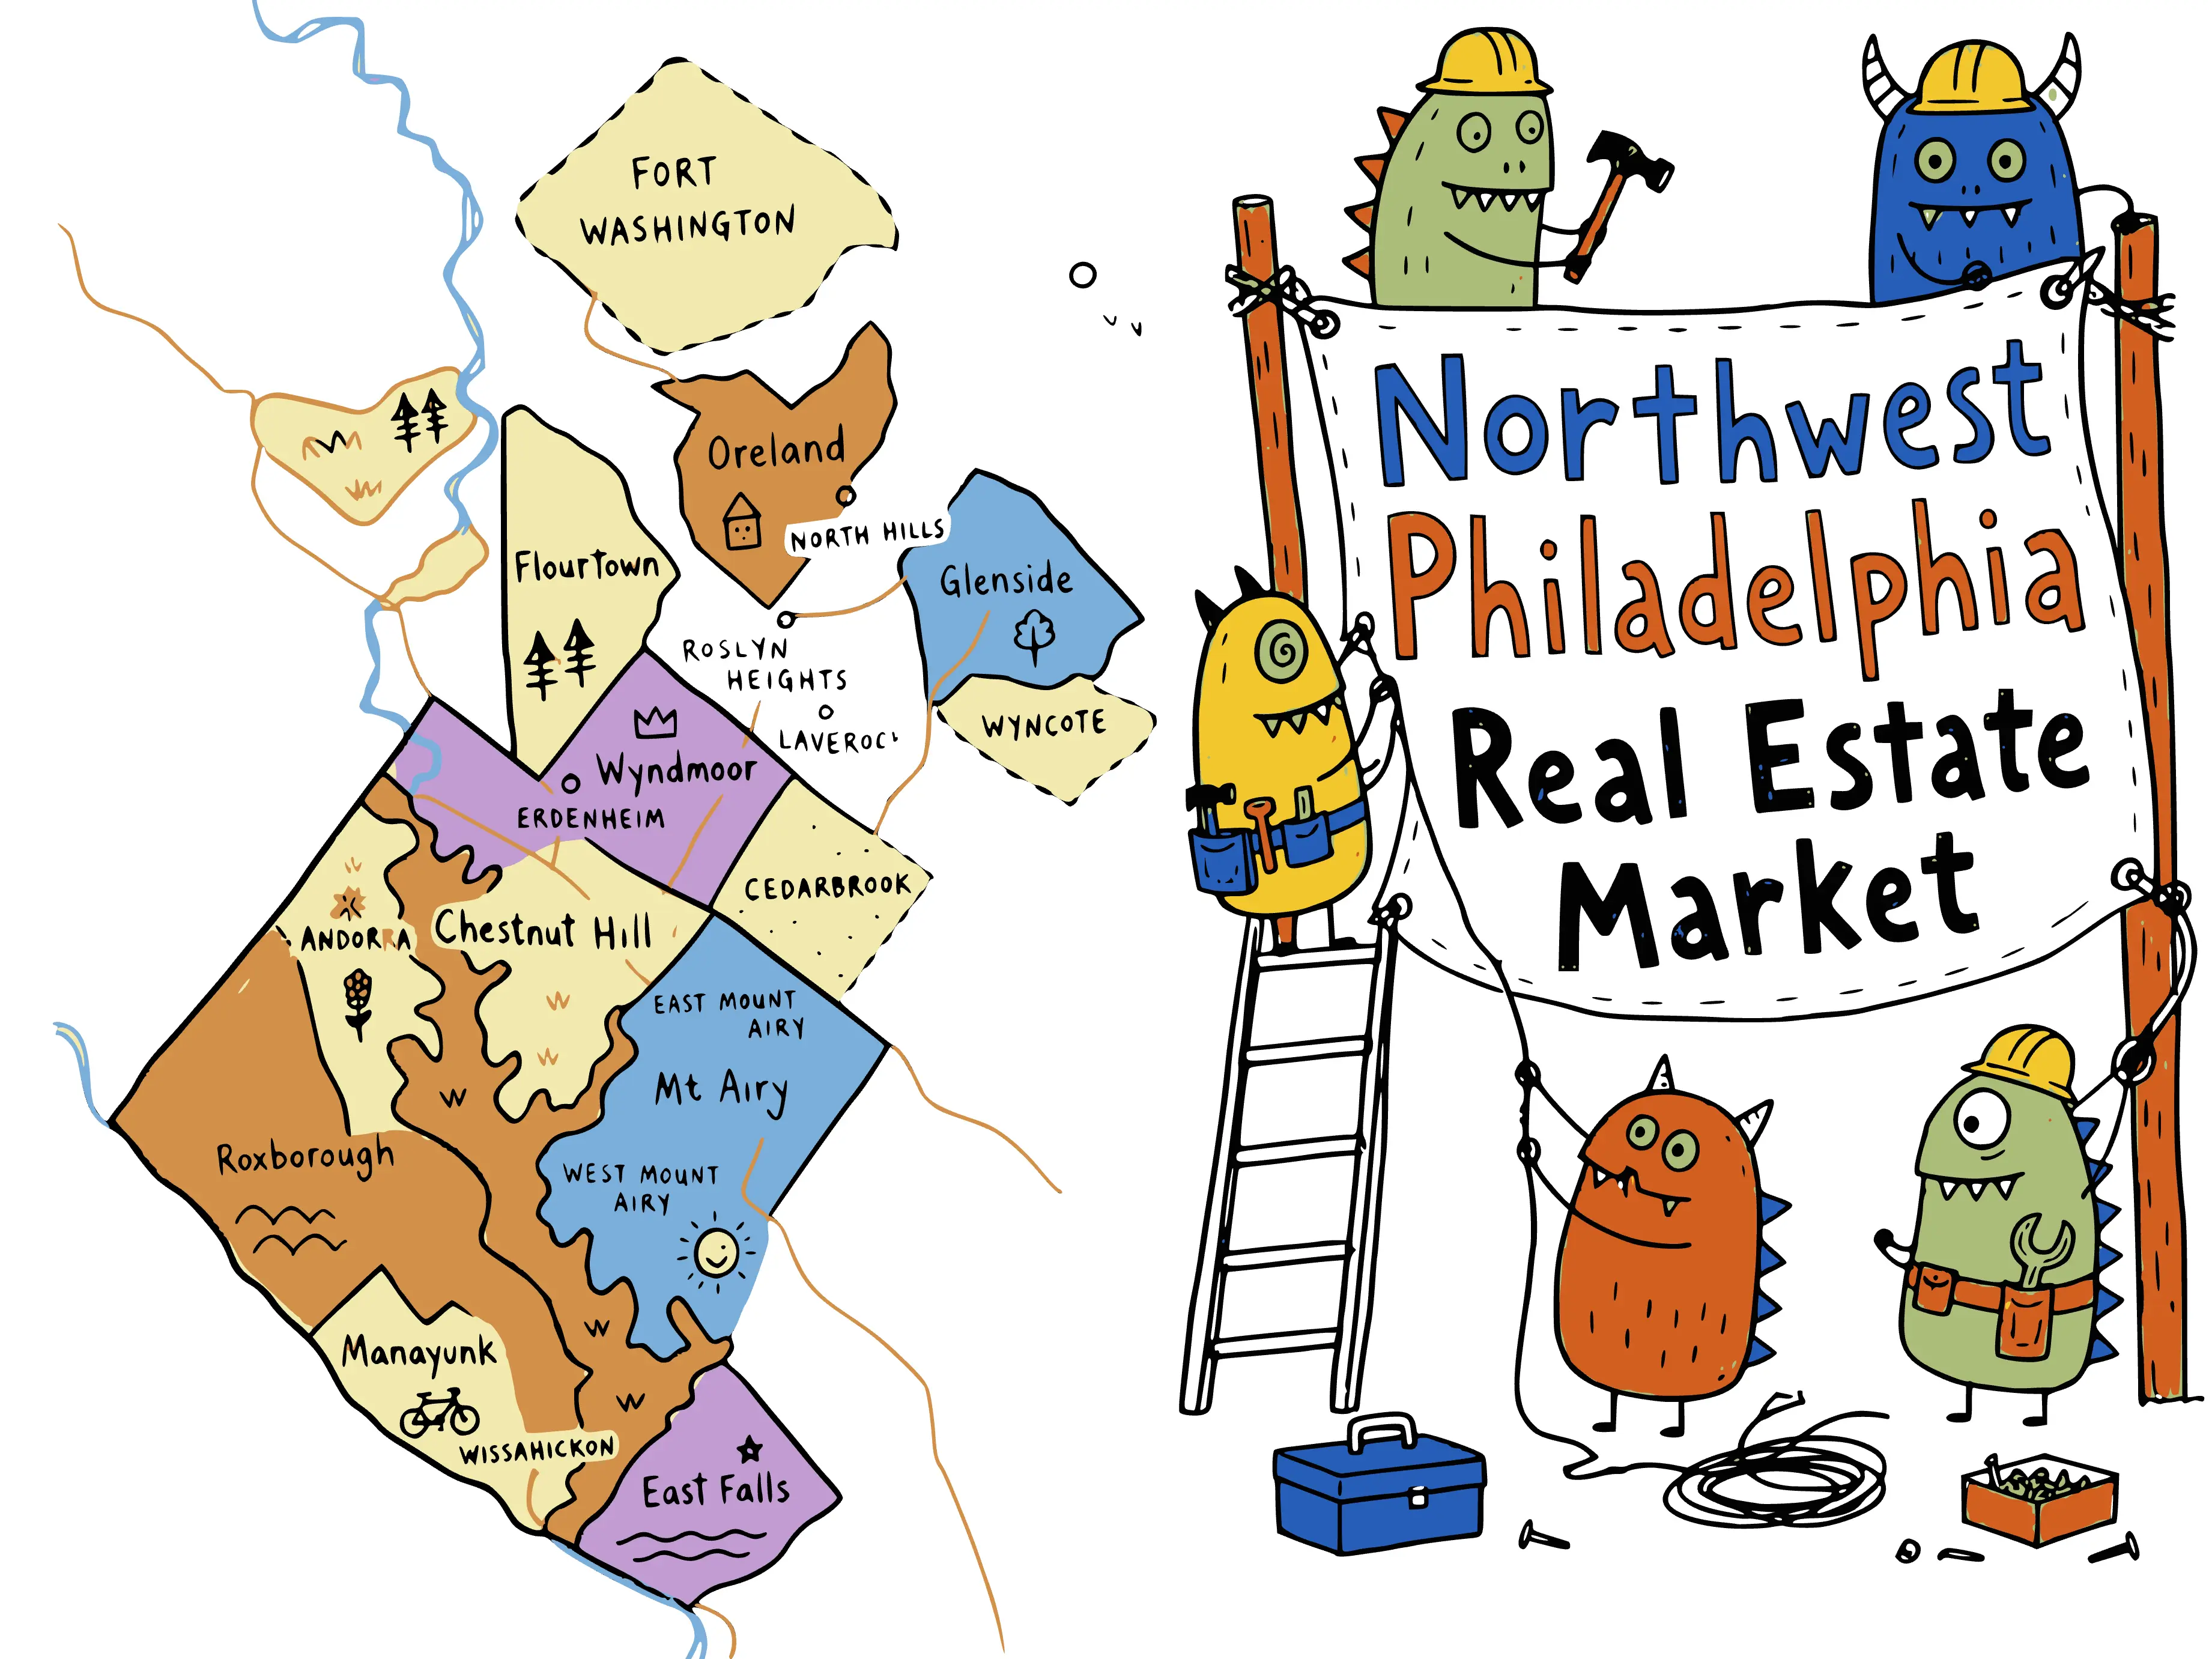
Nine communities: Mt. Airy, Chestnut Hill, East Falls, Manayunk and Roxborough in Northwest Philadelphia, and Wyndmoor, Flourtown, Oreland and Glenside in eastern Montgomery County. The same nine appear in every monthly and quarterly report, so the numbers are comparable across the series.
How often is this page updated?
With each monthly Bright MLS pull, shortly after month end. The dated posts in the Market Update archive are the permanent record of each month, and this page always shows the most recent numbers.