The Federal Reserve held its rate on October 28, and the decision barely moved mortgage rates, which ended the month a little above 7 percent. October was the first full month above that line, so it's the first read on how Northwest Philadelphia buyers responded. The five Philadelphia zip codes I cover put 71 homes under contract, down from 78 in September, per Bright MLS, while the number of homes for sale held at a 12-month high.
The Fed held, and mortgage rates barely moved
The Federal Reserve left its benchmark rate at 3.75 to 4 percent on October 28, six weeks after raising it a quarter point, according to its statement. The vote was 10 to 2, and the two dissenters, Lisa Cook and Beth Hammack, preferred another quarter-point increase. The statement also changed its description of the economy, which went from expanding at a "solid" pace in September to a "strong" one, while saying that inflation "remains elevated."
Inflation helps explain why the Fed isn't in a hurry to cut its rate. Consumer prices rose 3.7 percent in the 12 months through September, according to the Bureau of Labor Statistics. The Fed measures its 2 percent goal with a different gauge, the PCE price index, and that rose 3.6 percent over the same period, according to the Bureau of Economic Analysis, so either way inflation is well above where the Fed wants it.
The October Fed decision: rate held, with markets leaning toward a December increase
June through December 2026 · Federal Reserve, Treasury, Mortgage News Daily, BLS and BEA
Federal funds target range
A small move on the day, then lower
10-year Treasury yield
- 4.99%Oct. 27
- 5.05%Oct. 28, Fed day
- 4.94%Oct. 30
30-year fixed, Mortgage News Daily
- 7.33%Oct. 27
- 7.35%Oct. 28, Fed day
- 7.27%Nov. 2
Inflation is above the Fed's goal
See the data behind this graphic
| Measure | Date | Reading |
|---|---|---|
| Fed funds target range | From December 11, 2025 | 3.50–3.75% |
| Fed funds target range | From September 17, 2026 | 3.75–4.00% |
| Range priced by markets, not decided | December 8–9, 2026 meeting | 4.00–4.25% |
| 10-year Treasury yield | October 27 / 28 / 30, 2026 | 4.99% / 5.05% / 4.94% |
| 30-year fixed, Mortgage News Daily | October 27 / 28, November 2, 2026 | 7.33% / 7.35% / 7.27% |
| CPI, 12 months through September | Released October 14, 2026 | 3.7% |
| PCE price index, 12 months through September | Released October 29, 2026 | 3.6% |
| The Fed's inflation goal, measured on PCE | 2.0% |
Traders had expected the hold. CME's FedWatch tool showed less than a 10 percent chance of an increase going in, as CNBC reported, so there was no surprise to react to. Mortgage News Daily's index rose to 7.35 percent that day from 7.33, and that publisher said the announcement had no impact, since the bond weakness behind the rise in rates began beforehand. The 10-year Treasury yield, the number mortgage rates tend to follow, rose to 5.05 percent from 4.99, according to the Treasury.
The 10-year yield and Mortgage News Daily's index have both come down since. The yield fell to 4.94 percent by October 30, and the index was at 7.27 percent on November 2, after a bond rally on October 29 that it tied to weak stock prices. Freddie Mac's weekly survey, which is the rate I track in these reports, peaked at 7.40 percent on October 8 and 15 and read 7.24 on October 29. It's a weekly average, so it won't match a daily index on any given day. A year earlier, on October 30, 2025, the same survey read 6.17.
The next Fed meeting is December 8 and 9. After the decision, FedWatch put the chance of another quarter-point increase at about 83 percent, as Fox Business reported, which would take the range to 4 to 4.25 percent. That's what traders expected at the time, and new inflation and jobs reports can change it. As I wrote in September, an increase doesn't translate directly into mortgage rates, because the bond market tends to move first.
So I wouldn't plan around a big drop in mortgage rates in the next few months, though they do move from week to week, as late October showed. On a $400,000 loan, principal and interest runs $2,442 a month at 6.17 percent and $2,726 at 7.24 percent. That's $284 more each month than a year ago, and it's about $44 less than at the 7.40 percent peak, so it's worth running your numbers at this week's rate.
October, neighborhood by neighborhood
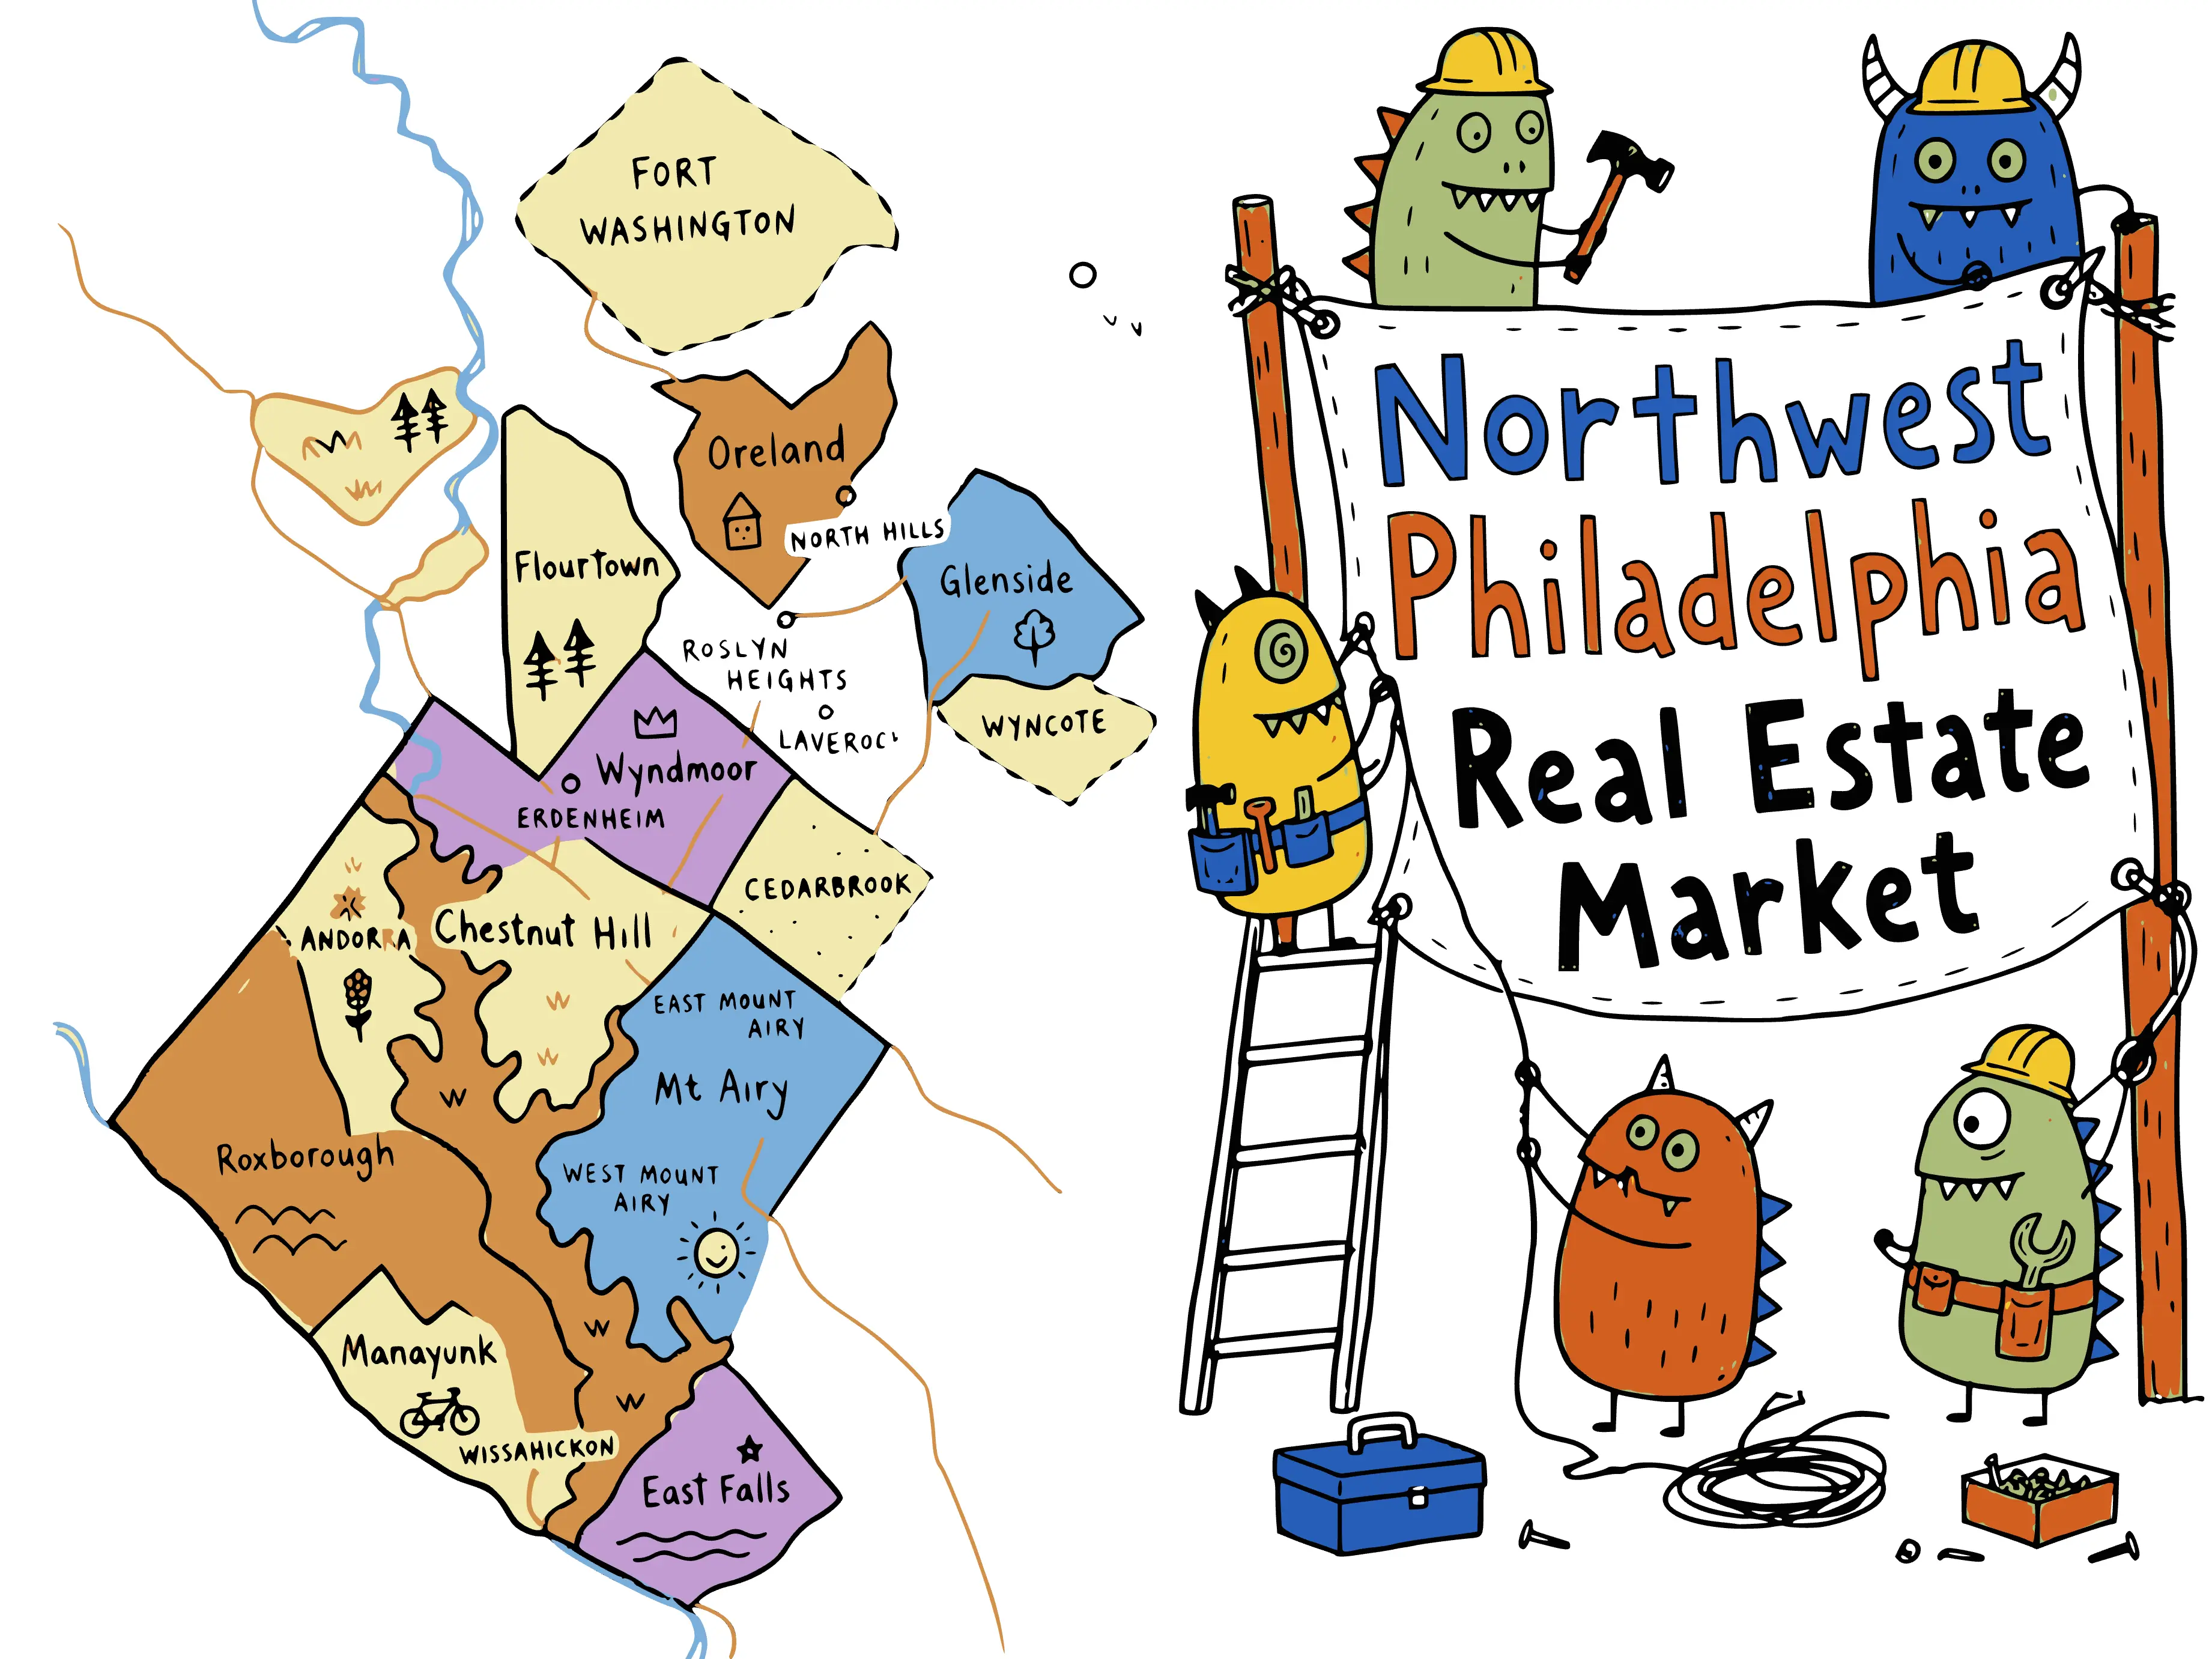
A total of 124 homes closed in October across the nine communities I work in, per Bright MLS, down from 128 in September once late-recorded sales are counted. Those closings mostly reflect contracts signed in August and September. A monthly median moves with the mix of what sold, and in a town with a handful of closings one unusual sale can move it a lot, so it's best to read these as a description of the month.
October 2026 closed sales by community
October 1 through October 31, 2026 · Bright MLS residential closings
See the data behind this chart
| Community | Homes closed | Median sale price |
|---|---|---|
| Roxborough | 41 | $389,000 |
| Mt. Airy | 22 | $448,250 |
| Glenside | 20 | $500,850 |
| Chestnut Hill | 16 | $757,500 |
| East Falls | 9 | $385,000 |
| Manayunk | 8 | $280,000 |
| Flourtown | 5 | $662,500 |
| Wyndmoor | 2 | Two sales |
| Oreland | 1 | One sale |
Wyndmoor's two sales and Oreland's one are too few for a median, so the chart and table don't show one.
Here are the same areas with pace and supply. Days on market is the average for the city zip codes and the median for the smaller towns. Months of supply is Bright's figure, which divides month-end inventory by the prior month's closings.
- Chestnut Hill (19118): 16 sold, $757,500 median, 42-day average, 4.5 months of supply
- Mt. Airy (19119): 22 sold, $448,250 median, 33-day average, 3.8 months of supply
- Manayunk (19127): 8 sold, $280,000 median, 42-day average, 2.7 months of supply
- Roxborough (19128): 41 sold, $389,000 median, 25-day average, 3.5 months of supply
- East Falls (19129): 9 sold, $385,000 median, 27-day average, 3.5 months of supply
- Glenside (19038): 20 sold, $500,850 median, 8.5-day median time on market
- Flourtown (19031): 5 sold, $662,500 median, 14-day median
- Wyndmoor (19038): 2 sold, at $580,000 and $833,000, under contract in eight and three days
- Oreland (19075): 1 sold, at $455,000, 16 days on market
Roxborough closed 41 sales, 19 more than any other community, at a $389,000 median. That's close to its 12-month median of $396,250, and its monthly medians have run from $355,000 to $420,000 over the past year. Bright has since revised September to 41 sales at $360,000, up from the 39 at $350,000 I first reported.
Mt. Airy's 22 sales closed at a $448,250 median, nearly level with a September figure Bright has revised to $450,000 from $482,500. Half of the 22 went under contract within two weeks, and four took 60 days or more, including one at 144.
Chestnut Hill had its busiest month of the past year, with 16 closings at a $757,500 median, after 12 homes went under contract in September. The sales split between quick and slow, since six went under contract within a week and six took 60 days or more. Bright's 4.5 months of supply divides the 27 homes for sale by September's six closings. October had 16 closings, and at that pace the same homes would sell in about 1.7 months. So Chestnut Hill's supply is somewhere between those two, and I'd watch November before calling it either.
In East Falls, nine sales closed at a $385,000 median, and five of them landed between $375,000 and $424,900. Manayunk closed eight sales at a $280,000 median, which ties February for the lowest of the past year. Six of its eight sold between $205,000 and $315,000, and the 12-month median of $374,900 is the steadier number.
In Montgomery County, Glenside closed 20 sales at a $500,850 median, up from $425,000 in September, per Bright MLS. That jump comes largely from which homes sold, because September had eight sales below $400,000 and October had none. Flourtown's five sales closed at a $662,500 median, and all five closed below their original asking prices, including a new-construction townhome on Pennybrook Court that had been listed for 157 days. Wyndmoor's two sales both closed above their original asking prices. Oreland's one sale closed at $455,000, above its original asking price, after going under contract in August.
Contracts slipped in the first full month above 7 percent
Closings describe the past, because a sale that closed in October was usually struck in August or September, so new contracts are the better read on October itself. In September I said this count would be the first to show how buyers respond if rates held above 7 percent, and rates did hold above it. The five Philadelphia zip codes put 71 homes under contract, per Bright MLS. That's down from 78 in September and 84 in October 2025. Rates were about a full point lower a year ago, though that alone doesn't show why the count fell.
Homes going under contract per month
November 2025 through October 2026 · Bright MLS · tap a legend entry to isolate a neighborhood
See the data behind this chart
| Month | Roxborough | Mt. Airy | Manayunk | East Falls | Chestnut Hill | All five |
|---|---|---|---|---|---|---|
| Nov 2025 | 26 | 13 | 6 | 7 | 6 | 58 |
| Dec 2025 | 15 | 12 | 1 | 3 | 4 | 35 |
| Jan 2026 | 27 | 6 | 7 | 9 | 4 | 53 |
| Feb 2026 | 17 | 7 | 0 | 9 | 5 | 38 |
| Mar 2026 | 28 | 19 | 13 | 7 | 6 | 73 |
| Apr 2026 | 33 | 15 | 7 | 8 | 7 | 70 |
| May 2026 | 31 | 16 | 9 | 10 | 8 | 74 |
| Jun 2026 | 32 | 13 | 8 | 7 | 9 | 69 |
| Jul 2026 | 42 | 24 | 6 | 6 | 3 | 81 |
| Aug 2026 | 22 | 17 | 6 | 8 | 4 | 57 |
| Sep 2026 | 30 | 17 | 9 | 10 | 12 | 78 |
| Oct 2026 | 31 | 18 | 2 | 12 | 8 | 71 |
The drop from September is modest, and it isn't spread evenly, which is why I'd be careful about reading it as a verdict on rates. Three of the five zip codes went up: Roxborough to 31 from 30, Mt. Airy to 18 from 17 and East Falls to 12 from 10, which is its highest count of the past year. The decline came from Chestnut Hill, down to eight from 12, and Manayunk, down to two from nine, and those are small enough counts that a few deals can swing them. One month also can't separate the effect of rates from the usual slowdown heading into winter, so November's count will help.
The metro-wide gauge held flat. The T3 Home Demand Index for the Philadelphia metro read 78 in October, the same as a revised September, and that's six points below its 84 of a year ago. Every segment sits below its year-ago level, though luxury condos jumped 20 points on the month on only 47 sales.
Homes for sale stayed at a 12-month high
Sellers kept listing, though a little more slowly. The five zip codes took 149 new listings in October, per Bright MLS, down from 156 in September and about level with 148 a year earlier. New listings ran at about twice the 71 homes that went under contract. The five zip codes ended the month with 333 homes for sale, the same as September, which ties it as the highest month-end count of the past year. At September's pace of 94 closings, the basis Bright uses, that's about 3.5 months of supply, meaning the homes listed at the end of October would take about that long to sell if sales held steady.
Active listings at month end
November 2025 through October 2026 · Bright MLS · tap a legend entry to isolate a neighborhood
See the data behind this chart
| Month | Roxborough | Mt. Airy | Manayunk | East Falls | Chestnut Hill | All five |
|---|---|---|---|---|---|---|
| Nov 2025 | 107 | 59 | 28 | 45 | 14 | 253 |
| Dec 2025 | 82 | 52 | 28 | 39 | 12 | 213 |
| Jan 2026 | 79 | 51 | 26 | 34 | 9 | 199 |
| Feb 2026 | 84 | 50 | 35 | 31 | 10 | 210 |
| Mar 2026 | 96 | 52 | 30 | 30 | 14 | 222 |
| Apr 2026 | 110 | 74 | 37 | 36 | 21 | 278 |
| May 2026 | 125 | 79 | 30 | 40 | 29 | 303 |
| Jun 2026 | 129 | 86 | 39 | 39 | 35 | 328 |
| Jul 2026 | 122 | 80 | 39 | 46 | 32 | 319 |
| Aug 2026 | 125 | 67 | 39 | 38 | 25 | 294 |
| Sep 2026 | 143 | 79 | 40 | 41 | 30 | 333 |
| Oct 2026 | 144 | 92 | 32 | 38 | 27 | 333 |
The flat total hides some movement underneath. Roxborough ended October with 144 homes for sale and Mt. Airy with 92, each a 12-month high, while Manayunk fell to 32 from 40 and Chestnut Hill to 27 from 30.
How to use this in November
For buyers, the higher payment I covered above is the main change from a year ago, and there's more to choose from, with about 7 percent more homes for sale in the five zip codes than the 311 at the end of October 2025. If your preapproval is more than a few weeks old, it's worth rerunning it at this week's rate, since rates have moved around quite a bit since September. Supply gives you a little more room on price, credits and timelines for homes that have sat, though plenty of homes still go under contract within two weeks, including half of Mt. Airy's October sales.
For sellers, you're listing against as many competing homes as at any point in the past year, and buyers are looking at higher monthly payments. So it's worth pricing against the last 90 days of comparable sales, though the same October data shows plenty of homes still going under contract within two weeks. If you've been waiting for lower mortgage rates before you list, the December meeting doesn't look likely to help, since markets expect the Fed to raise its rate again. Mortgage rates may not move much on that alone, so I'd make the decision on the market we have now.
If you want these numbers run for your block or your price range, reach out, and I'm happy to pull them. When you're ready to talk about your own move, this is how I work with buyers and sellers across the area.
This report is one month in a running series. The standing market page always carries the current numbers, and the Market Update archive holds every dated report.
Henry is a Philadelphia-based REALTOR® serving buyers and sellers in Northwest Philadelphia and Montgomery County, PA. Questions? Get in touch.
Based on information from Bright MLS for 11/1/2025 through 10/31/2026; data is reliable but not guaranteed.
Frequently asked questions
Did the Fed raise rates in October 2026?
No. The Federal Reserve held the federal funds rate at a range of 3.75 to 4 percent on October 28, 2026, six weeks after raising it a quarter point. The vote was 10 to 2. Both dissenters preferred another quarter-point increase.
What happened to mortgage rates after the Fed's October decision?
Very little on the day. Mortgage News Daily's index rose to 7.35 percent on October 28 from 7.33 percent, and that publisher said the announcement itself had no impact. Its index fell to 7.27 percent by November 2. Freddie Mac's weekly survey read 7.24 percent on October 29, down from 7.32 percent a week earlier.
Will the Fed raise rates in December 2026?
It hasn't decided. The next meeting is December 8 and 9. After the October decision, CME's FedWatch tool put the chance of a quarter-point increase at about 83 percent, as reported by Fox Business. That's a market estimate, and new inflation and jobs data can change it.
How did the Northwest Philadelphia housing market perform in October 2026?
A total of 124 homes closed across the nine communities in this report, per Bright MLS. That's down from 128 in September once late-recorded sales are counted. The five Philadelphia zip codes put 71 homes under contract, down from 78. They ended October with 333 homes for sale, the same as September and the highest month-end count of the past year.
How much does the higher mortgage rate change a monthly payment?
On a $400,000 loan with a 30-year fixed rate, principal and interest comes to $2,442 a month at 6.17 percent, the Freddie Mac average on October 30, 2025. At 7.24 percent, the average on October 29, 2026, it's $2,726. That's $284 more each month for the same loan, before taxes and insurance.