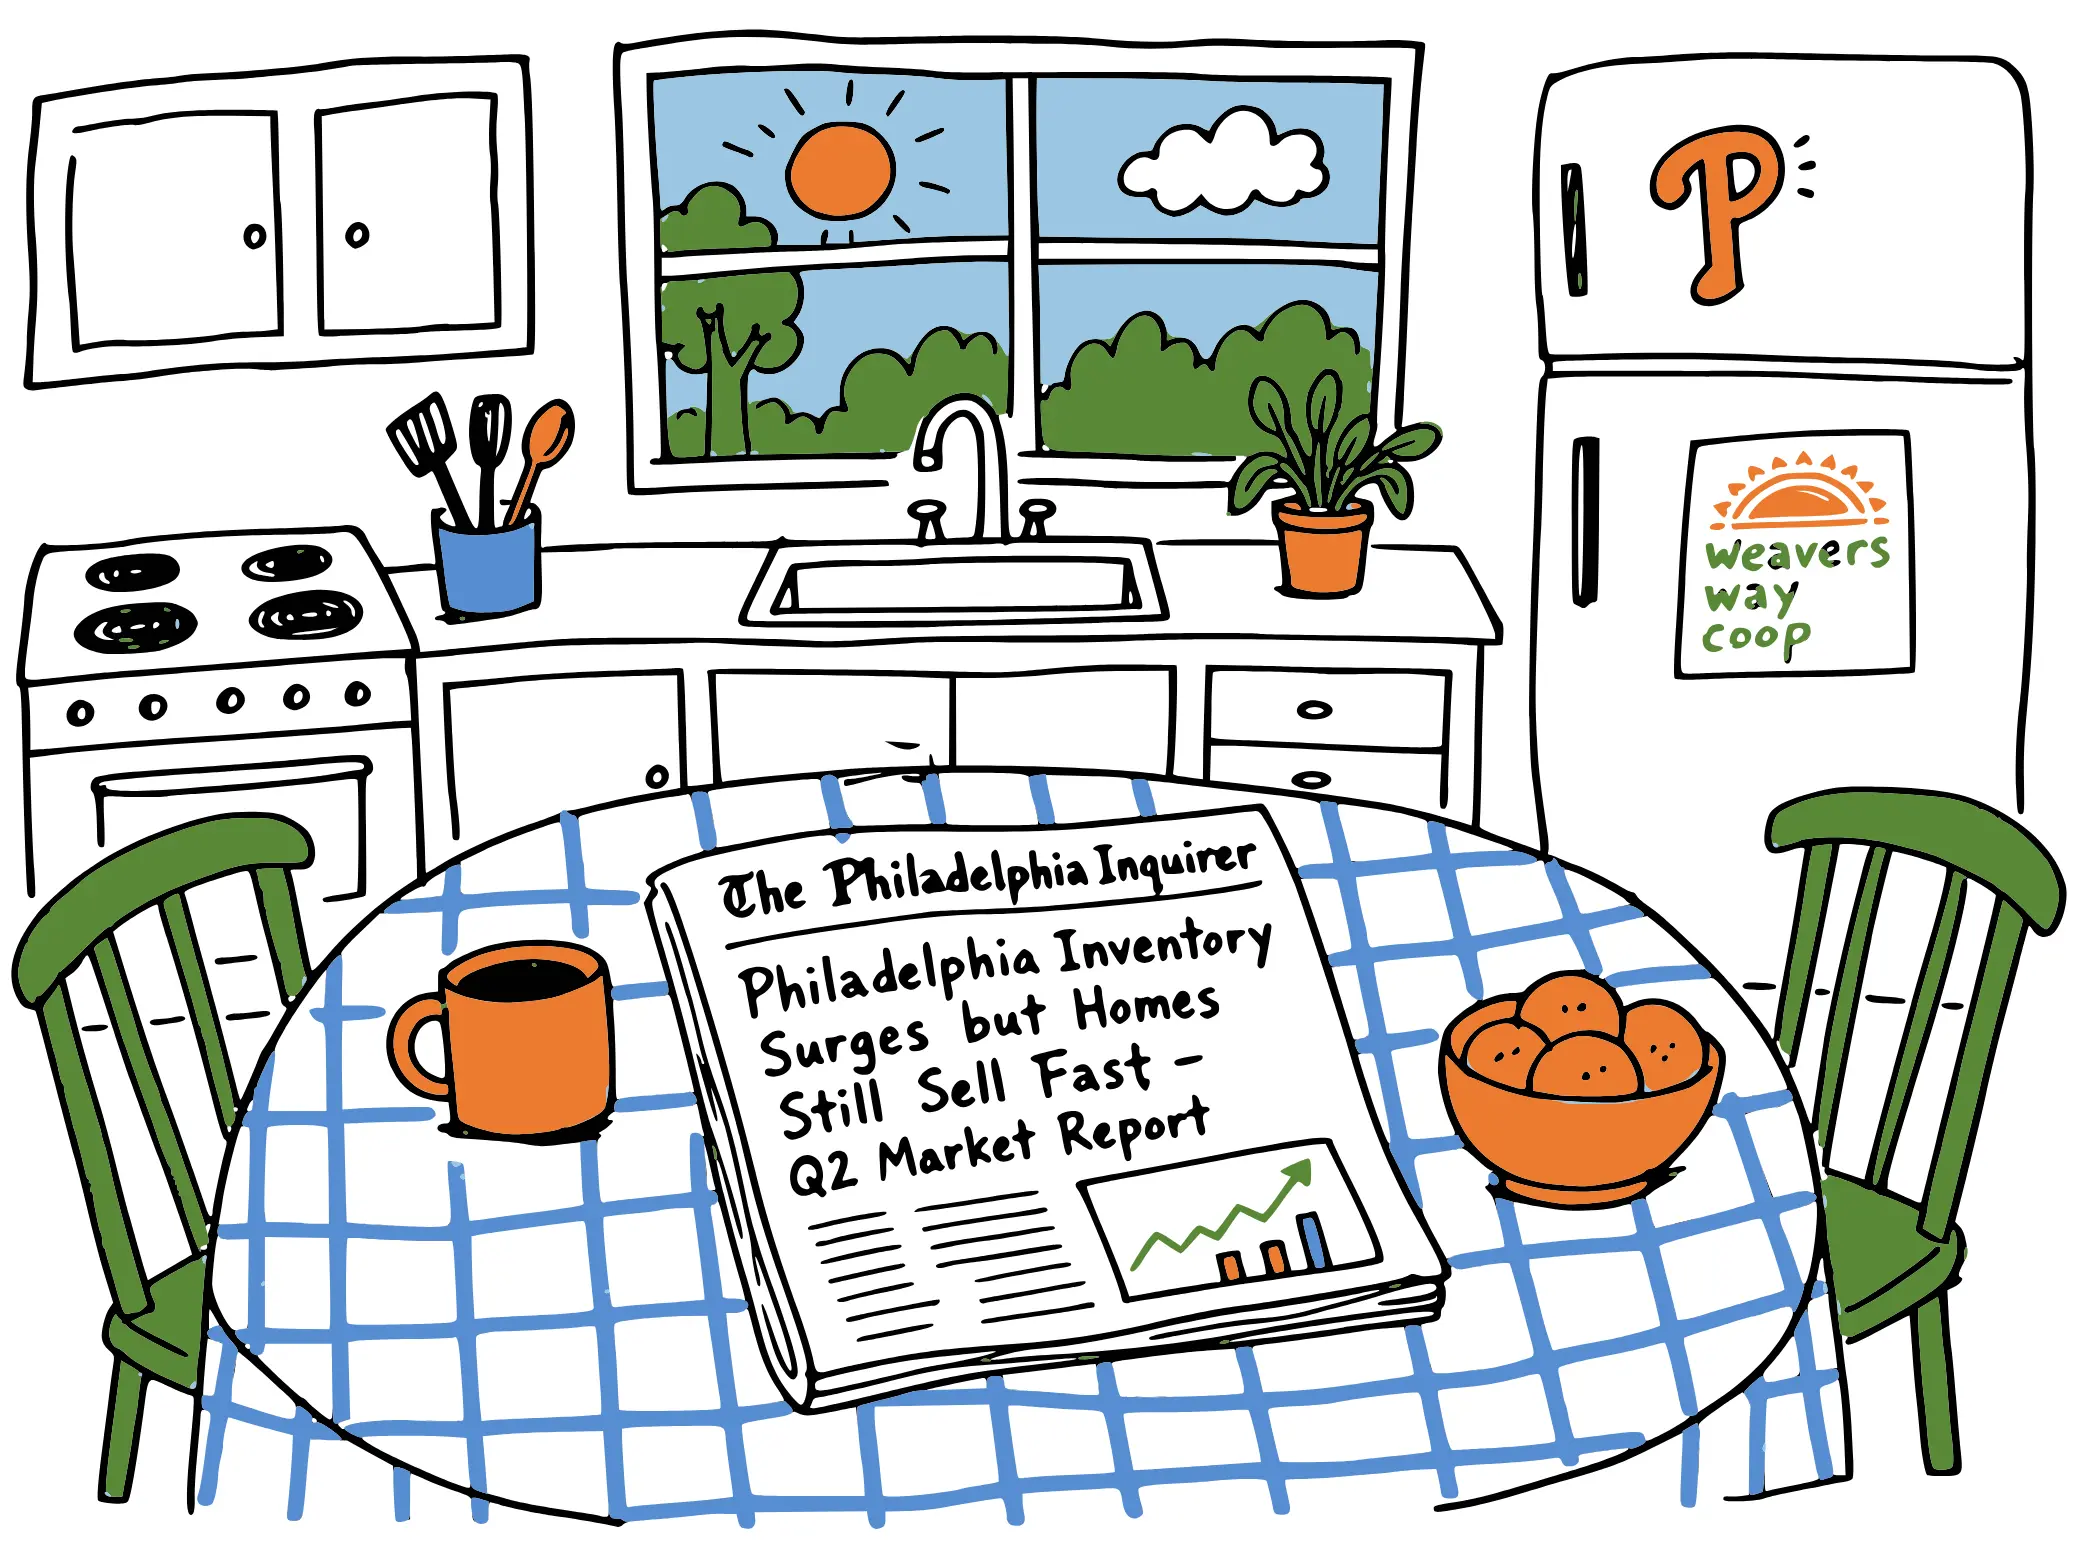
Earlier this month, the Philadelphia Inquirer published a report on the region's housing market, and two of the agents interviewed used the same word to describe it: weird. I agree with them. I sell homes in Northwest Philadelphia, and the Bright MLS data for the five zip codes I track shows the same things the article describes: more homes coming up for sale than we have seen in years, longer average sale times and well-priced homes still drawing multiple offers, all at the same time.
What the Inquirer found
Michaelle Bond's July 8 article is built on interviews with agents across the region, and their stories line up. Jake Markovitz, president of the Greater Philadelphia Association of Realtors board, called the market "certainly more balanced than it has been the last four, five years." Agents described homes that sat unsold all fall and then went under contract in the middle of winter, and houses that lingered for 30 days only to draw three offers in the same weekend. A Montgomery County team leader said demand now varies "almost like a property-by-property basis," even between similar homes.
The rise in supply shows up in national data too. For the four weeks ending June 21, the Philadelphia region had one of the five largest annual increases in new listings among the 50 most populous metros, according to a Redfin analysis cited in the article. That is a big shift for a market Zillow picked at the start of the year as one of the 10 most competitive in the country for 2026. Mortgage rates have held near 6.5 percent for a 30-year fixed, per Freddie Mac's late-June average, and many owners are reluctant to give up the 3 percent loans they got five years ago. Markovitz calls them "bound by their golden handcuffs." But people still move for the usual reasons: growing families, deaths, job changes. Those homes come to market no matter where rates are.
Buyers, meanwhile, have gotten pickier. The agents interviewed described buyers who are asking for inspections again, passing on homes that need updating and paying top dollar only for move-in-ready houses. Sellers who price too high are sitting. "If you overprice by even just a little bit," one agent told the Inquirer, "you'll end up sitting."
The sellers showed up
The biggest change in my area is the number of homes coming up for sale. Here are monthly new listings for the five zip codes I track, from Bright MLS.
New listings per month by neighborhood
July 2025 through June 2026 · Bright MLS · tap a legend entry to isolate a neighborhood
See the data behind this chart
| Month | Roxborough | Mt. Airy | Manayunk | East Falls | Chestnut Hill | All five |
|---|---|---|---|---|---|---|
| Jul 2025 | 57 | 37 | 14 | 15 | 7 | 130 |
| Aug 2025 | 43 | 32 | 19 | 15 | 7 | 116 |
| Sep 2025 | 73 | 37 | 12 | 15 | 13 | 150 |
| Oct 2025 | 70 | 37 | 15 | 18 | 8 | 148 |
| Nov 2025 | 43 | 13 | 9 | 12 | 4 | 81 |
| Dec 2025 | 24 | 12 | 5 | 6 | 8 | 55 |
| Jan 2026 | 41 | 17 | 10 | 10 | 9 | 87 |
| Feb 2026 | 30 | 19 | 15 | 8 | 7 | 79 |
| Mar 2026 | 63 | 32 | 16 | 17 | 11 | 139 |
| Apr 2026 | 73 | 42 | 26 | 20 | 18 | 179 |
| May 2026 | 75 | 39 | 12 | 22 | 23 | 171 |
| Jun 2026 | 69 | 42 | 21 | 16 | 22 | 170 |
Sellers in Roxborough, Mt. Airy, Manayunk, East Falls and Chestnut Hill listed 520 homes between April and June. April (179), May (171) and June (170) were the three biggest listing months of the past year. The previous high was last summer, when July through September produced 396, so this spring came in 31 percent above that. The increase showed up everywhere. Roxborough went from 24 new listings in December to between 69 and 75 in each of the spring months, and Mt. Airy had its two busiest months of the year in April and June.
Chestnut Hill stands out. In the article, Markovitz said: "I'm seeing more inventory in Chestnut Hill than I have in a long time, which is giving buyers a little bit of power." The data backs him up. Chestnut Hill had 27 new listings last July through September and 63 this April through June, more than double. Its active inventory grew from nine homes in January to 35 at the end of June. I wrote about that buildup in my Q2 market report, and it is still the biggest supply change in these five zip codes.
An average sale took 59 days in February and 24 in June
Average days on market for closed sales
July 2025 through June 2026 · Bright MLS · five zip codes combined, weighted by each month's closings
See the data behind this chart
| Month | Avg days on market | Homes closed |
|---|---|---|
| Jul 2025 | 22 | 92 |
| Aug 2025 | 37 | 84 |
| Sep 2025 | 30 | 90 |
| Oct 2025 | 39 | 99 |
| Nov 2025 | 36 | 108 |
| Dec 2025 | 37 | 91 |
| Jan 2026 | 34 | 72 |
| Feb 2026 | 59 | 49 |
| Mar 2026 | 45 | 98 |
| Apr 2026 | 44 | 98 |
| May 2026 | 32 | 99 |
| Jun 2026 | 24 | 113 |
Days on market is measured when a home closes, so each point on the chart describes the homes that finished selling that month. The 49 homes that closed in February had spent an average of 59 days on the market, which means they went under contract in the middle of winter, many after sitting for a while and cutting their price. The average stayed in the mid-40s through March and April as the slower winter listings worked through. Then it fell fast: the 113 homes that closed in June, the biggest month of the year, averaged just 24 days. That is the normal seasonal pattern running backwards: homes sat through the fall and sold in the winter. It matches what the Inquirer's agents reported across the region.
One note on the chart: it combines all five zip codes, weighted by each month's number of closings. Individual neighborhoods swing a lot in slow months, because a single unusual sale can move the average. Chestnut Hill's August 2025 average, for example, was 124 days across just eight closings. Per-neighborhood figures are on the neighborhood pages.
The average also hides a split. Half of the 435 homes that closed across the nine communities I cover in the second quarter went under contract within eight days of listing. The only way to get an eight-day median and a 44-day monthly average out of the same market is if there are really two groups of homes: those priced in line with recent sales, which sell within a week or two, and overpriced ones that sit for months. That is exactly the split the Inquirer article describes: some homes lingering unsold while others draw five or more competing offers.
What I am telling buyers and sellers
For sellers: the first two weeks matter most. If you price in line with recent comparable sales, the current pace says you should be under contract inside that window. If you overprice, you join the group that dragged February's average to 59 days. The article's warning matches what I see here: overprice "by even just a little bit" and you end up sitting. Presentation matters more than it did a year ago, too. These five zip codes ended June with 328 active listings, so buyers have plenty to compare against, and the article's agents say they pay top dollar only for move-in ready. Preparing and photographing the listing properly is part of getting the price right.
For buyers: you have more choice than you have had in years, and the winter numbers show that overpriced homes do come down eventually. But a well-priced home still only lasts about a week. Be ready to make an offer before you tour: lender letter, inspection plan and a firm ceiling on price. As one agent put it in the article: "You have to be ready to pounce the second [a home] comes to the market." And be careful with "buyer's market" headlines. I explained in the June update why that label does not really fit this area yet.
If you want to see these numbers for your block or your price range, reach out. I am happy to run them. And if this split market has you weighing a purchase, a sale or both, my services page lays out how I approach each.
Henry is a Philadelphia-based REALTOR® serving buyers and sellers in Northwest Philadelphia and Montgomery County, PA. Questions? Get in touch.
Based on information from Bright MLS for 7/1/2025 through 6/30/2026; data is reliable but not guaranteed.
Frequently asked questions
Why are agents calling the Philadelphia housing market weird in 2026?
Because it is doing opposite things at once. Supply is rising: the Philadelphia region posted one of the five largest annual increases in new listings among the 50 biggest metros in late June 2026, per a Redfin analysis cited by the Philadelphia Inquirer, and homes are taking longer to sell on average. At the same time, well-priced homes still draw multiple offers within days. Agents in the Inquirer's July 2026 report described homes sitting for months, then suddenly attracting several buyers at once.
Is housing inventory rising in Northwest Philadelphia?
Yes. April, May and June 2026 were the three biggest months for new listings in the trailing 12 months across the five Northwest Philadelphia zip codes, with 520 combined new listings, up 31 percent from the 396 of July through September 2025, per Bright MLS. Chestnut Hill more than doubled its pace, from 27 new listings in last summer's quarter to 63 this spring, and its active inventory grew from nine homes in January to 35 at the end of June.
How fast are homes selling in Northwest Philadelphia in mid-2026?
At two speeds. Half of the 435 homes that closed across the nine communities I cover in the second quarter of 2026 went under contract within eight days of listing, per Bright MLS. The monthly averages run much higher, 24 days for June closings and 59 for February closings, because a tail of overpriced or slower listings sits for months before selling. Pricing to recent comparables is what separates the two groups.