The second quarter of 2026 was the busiest stretch for our local housing market in at least a year. 435 homes closed across Northwest Philadelphia and the nearby Montgomery County towns I cover between April and June, per Bright MLS, up 46 percent from the 297 closings of the first quarter. The median sale price landed at $437,500, and half of everything that sold went under contract within 8 days of hitting the market.
This is the quarterly companion to my monthly updates, and this time the charts are interactive. Tap a legend entry to hide or show a neighborhood, and hover or tap any point for the exact figure.
The Quarter at a Glance
The winter felt slow, and the spring made up for it. February was the quietest month of the past year across the five Philadelphia zip codes I track, with 49 closed sales. June was the busiest, with 113. That is the seasonal rhythm doing what it does, but the size of the swing this year stood out, and the pipeline behind it stayed full: as of mid-July, another 176 homes across these nine communities are under contract and waiting to close.
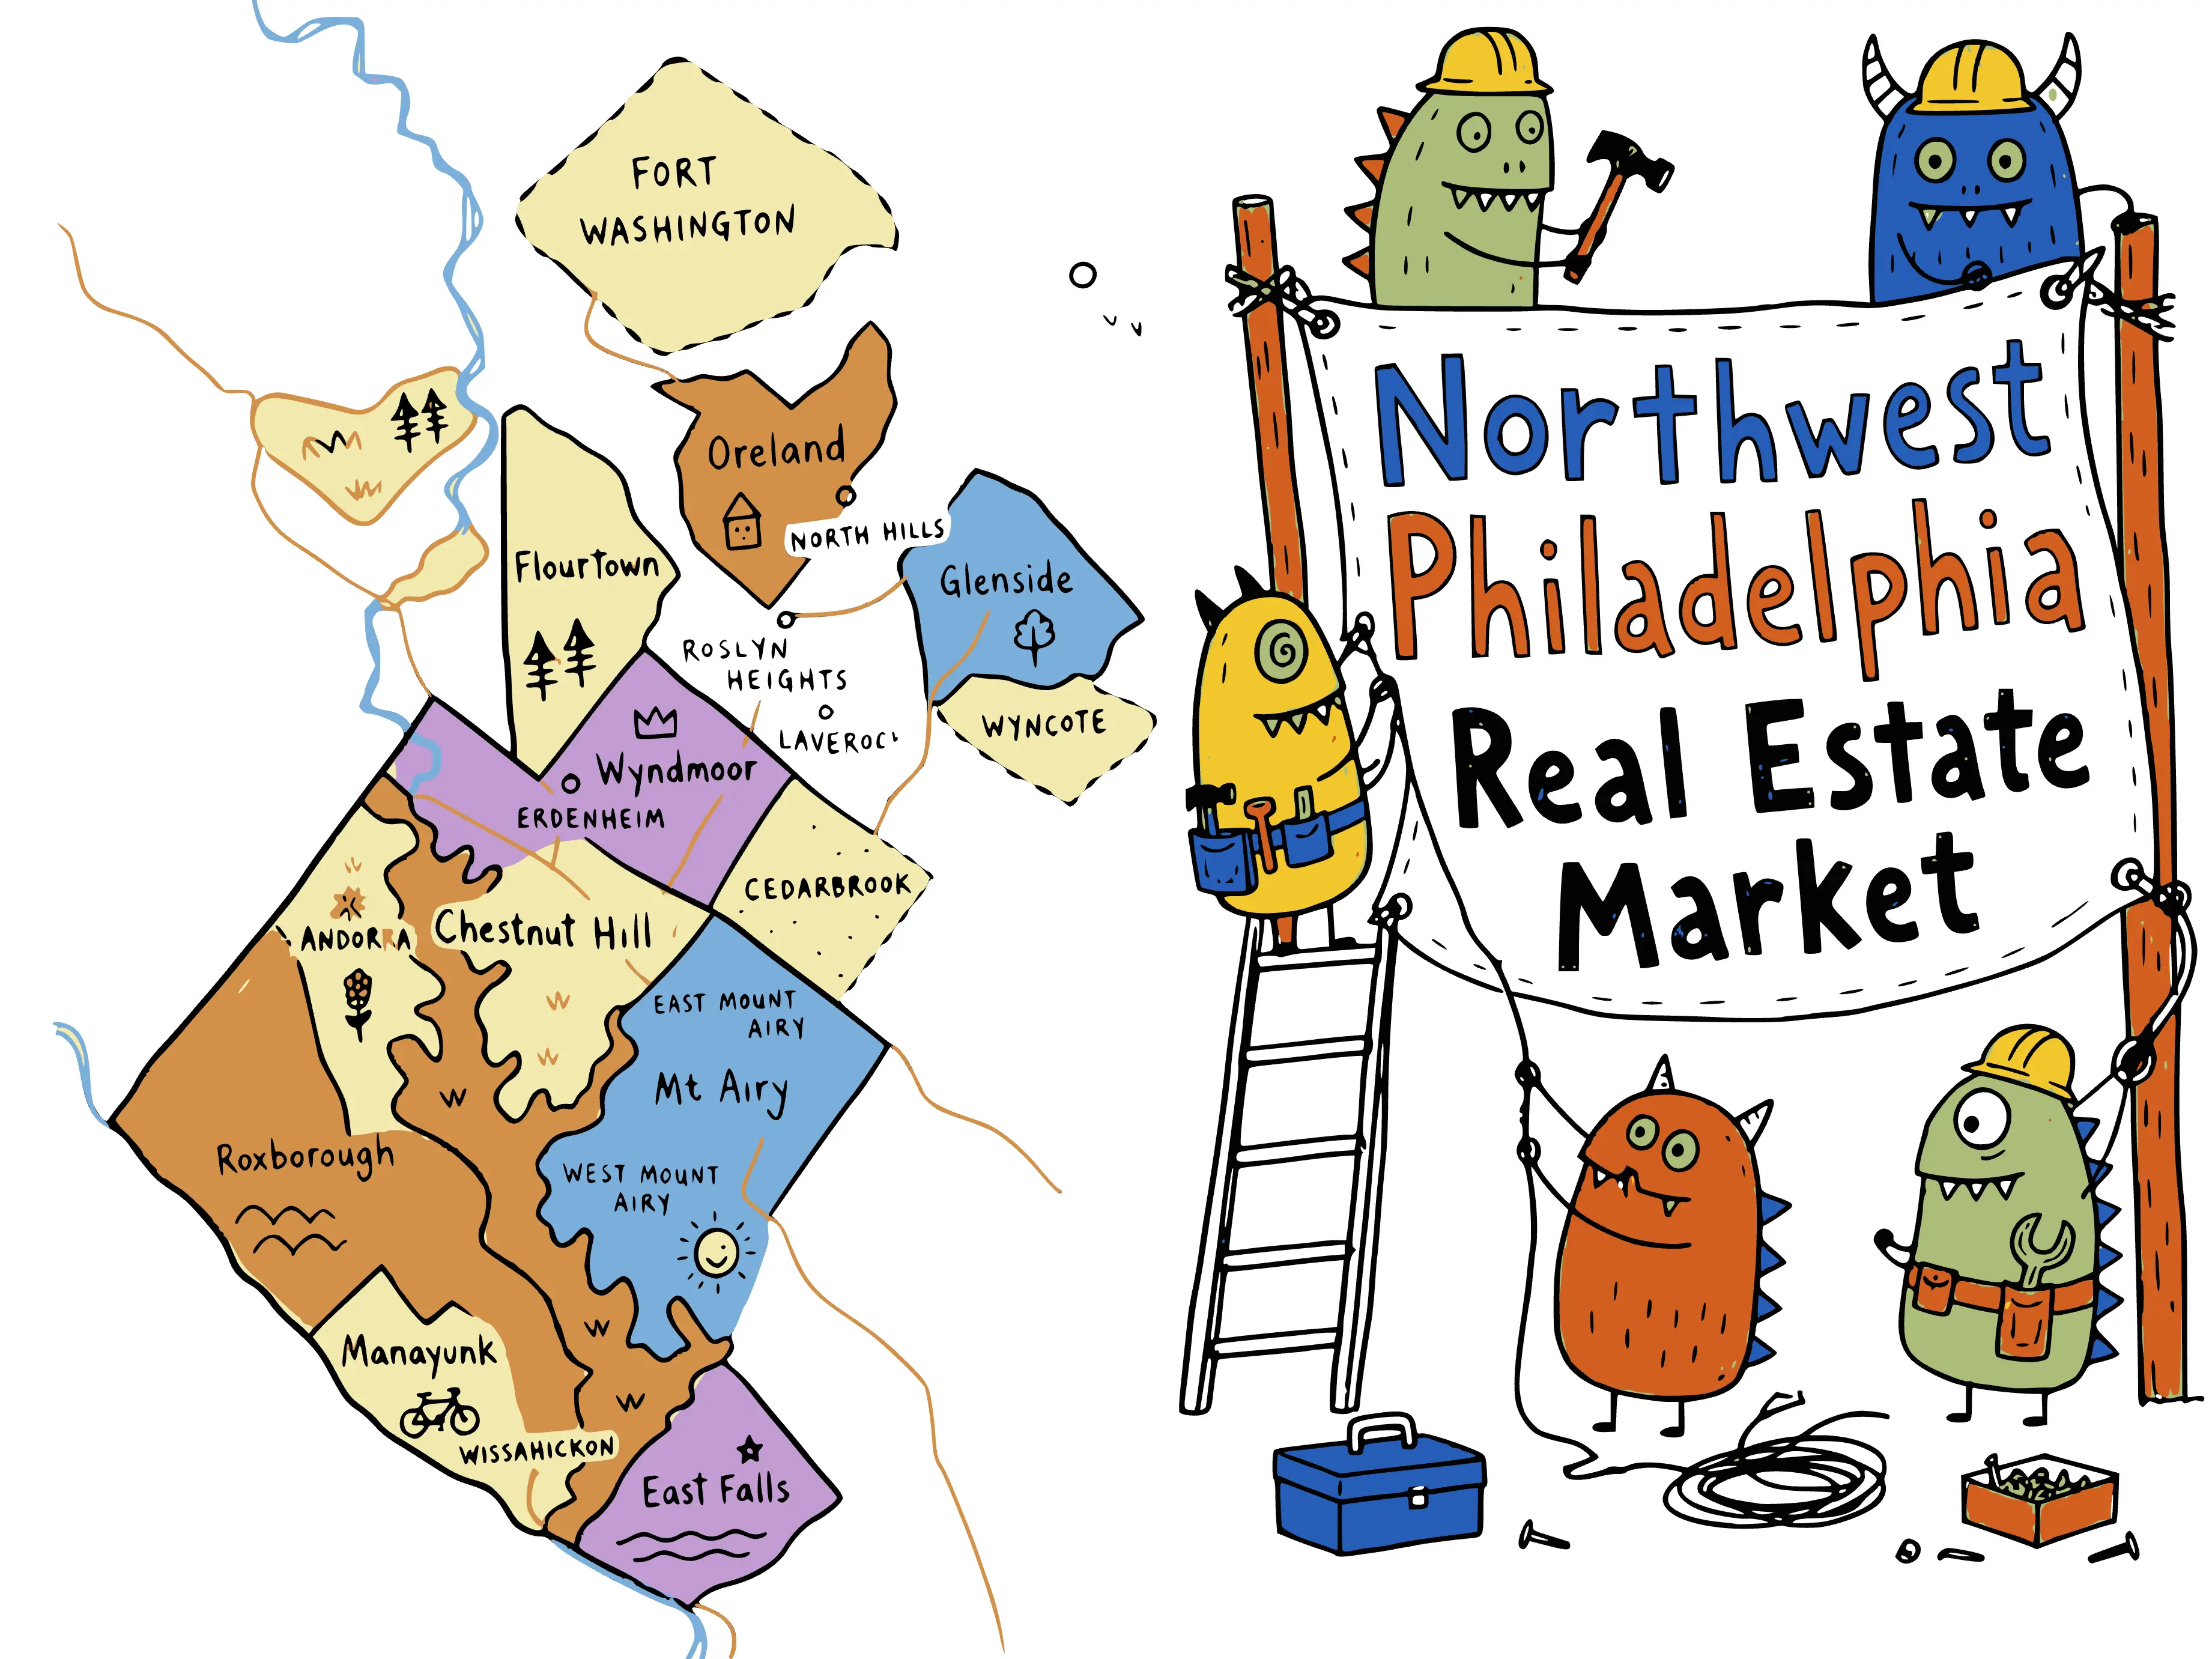
Neighborhood by Neighborhood
Q2 2026 closed sales by community
April through June 2026 · Bright MLS residential closings
See the data behind this chart
| Community | Homes closed | Median sale price | Median days on market |
|---|---|---|---|
| Roxborough | 153 | $399,990 | 10 |
| Glenside | 69 | $475,100 | 6 |
| Mt. Airy | 63 | $425,000 | 10 |
| Manayunk | 39 | $379,900 | 10 |
| East Falls | 38 | $371,500 | 10 |
| Chestnut Hill | 24 | $962,500 | 6 |
| Flourtown | 22 | $911,809 | 6 |
| Oreland | 14 | $583,500 | 6 |
| Wyndmoor | 13 | $800,000 | 4 |
Roxborough carried the quarter again: 153 closed sales at a median of $399,990, up from 94 sales at a $405,000 median in Q1. Volume rose more than 60 percent while the price held flat. That is a market with real depth. Plenty of buyers, plenty of sellers, and prices behaving.
Glenside was the strongest of the Montgomery County towns, with 69 closings at a $475,100 median and half of them under contract within 6 days. For a town of its size, that pace stands out.
Mt. Airy closed 63 sales at a $425,000 median, well above the winter quarter's figure near $350,000. A note of caution on reading that jump: medians move with the mix of what sold, and a run of larger stone homes closing in the same quarter will pull the number up. I read it as a strong spring rather than a 20 percent repricing.
Manayunk produced 39 closings at a $379,900 median. One of those was my own listing at 103 Kingsley St, which went under contract in 3 days and closed at $332,000, so I watched this market work from the inside this spring. The demand for a well-priced rowhome is real.
East Falls held steady: 38 closings at a $371,500 median, in line with its first quarter.
Chestnut Hill had a notable quarter. Twenty-four closings at a $962,500 median, up from 15 closings in Q1, with half of the sold homes under contract within 6 days. The upper bracket showed up this spring.
The smaller Montgomery County markets ran fast on thin volume. Flourtown closed 22 sales at a $911,809 median, a figure pulled up by several very large properties, so treat that as a mix story rather than a neighborhood repricing. Oreland closed 14 at $583,500, and Wyndmoor closed 13 at $800,000 with a median of just 4 days on market.
A Year of Sales Pace in One Chart
Homes sold per month by neighborhood
July 2025 through June 2026 · Bright MLS · tap a legend entry to isolate a neighborhood
See the data behind this chart
| Month | Roxborough | Mt. Airy | Manayunk | East Falls | Chestnut Hill |
|---|---|---|---|---|---|
| Jul 2025 | 50 | 17 | 6 | 10 | 9 |
| Aug 2025 | 33 | 24 | 9 | 10 | 8 |
| Sep 2025 | 39 | 25 | 8 | 10 | 8 |
| Oct 2025 | 50 | 18 | 9 | 17 | 5 |
| Nov 2025 | 50 | 20 | 11 | 13 | 14 |
| Dec 2025 | 44 | 17 | 10 | 9 | 11 |
| Jan 2026 | 32 | 20 | 6 | 8 | 6 |
| Feb 2026 | 26 | 8 | 5 | 8 | 2 |
| Mar 2026 | 32 | 22 | 13 | 24 | 7 |
| Apr 2026 | 40 | 22 | 12 | 14 | 10 |
| May 2026 | 46 | 19 | 14 | 14 | 6 |
| Jun 2026 | 63 | 21 | 12 | 10 | 7 |
The shape of the year is right there. A long, steady fall season, the January and February trough, and then a spring that climbed for four straight months. Roxborough's 63-sale June was the single biggest month any of these neighborhoods posted in the past year, and East Falls had its own moment in March with 24 closings, the strongest March in this dataset.
Buyers Finally Have More to Choose From
Active listings at the end of each month
July 2025 through June 2026 · Bright MLS end-of-month inventory
See the data behind this chart
| Month | Roxborough | Mt. Airy | Manayunk | East Falls | Chestnut Hill |
|---|---|---|---|---|---|
| Jul 2025 | 113 | 74 | 31 | 42 | 18 |
| Aug 2025 | 108 | 71 | 37 | 43 | 17 |
| Sep 2025 | 130 | 78 | 39 | 47 | 25 |
| Oct 2025 | 135 | 76 | 34 | 47 | 19 |
| Nov 2025 | 107 | 59 | 28 | 45 | 14 |
| Dec 2025 | 82 | 52 | 28 | 39 | 12 |
| Jan 2026 | 79 | 51 | 26 | 34 | 9 |
| Feb 2026 | 84 | 50 | 35 | 31 | 10 |
| Mar 2026 | 96 | 52 | 30 | 30 | 14 |
| Apr 2026 | 110 | 74 | 37 | 36 | 21 |
| May 2026 | 125 | 79 | 30 | 40 | 29 |
| Jun 2026 | 129 | 86 | 39 | 39 | 35 |
Here is the quieter story underneath the sales surge. The five Northwest Philadelphia zip codes ended June with 328 active listings, about 18 percent more than the 278 available at this point last summer. Chestnut Hill nearly doubled, from 18 to 35. I will be honest, that one surprised me when I pulled the numbers. I could feel the extra supply at open houses this spring, but seeing it on paper puts the season in perspective. East Falls was the only neighborhood with slightly less on the shelf than a year ago.
This is not just our corner of the city. Realtor.com's June market report for Philadelphia found metro active listings up 13.0 percent year over year, far ahead of the 1.9 percent national gain, with new listings up 9.4 percent. And the extra supply has not softened the market: Realtor.com put the metro median list price at $389,900, up 0.6 percent from a year ago while the national median fell 2.5 percent, and only 15.2 percent of Philadelphia listings took a price cut versus 18.8 percent nationally. More homes for sale and homes still selling fast is what a healthier market looks like, not a weaker one.
What This Means for the Second Half
For sellers, the 8-day median is the headline, but it comes with a condition. Homes that are priced to their comparables are the ones selling in the first week; the market is deciding quickly in both directions. And with meaningfully more competition on the shelf than last summer, especially in the upper brackets, pricing right matters more than it did a year ago.
For buyers, this is the most choice you have had in a while, and the fall usually brings a touch more negotiating room as the spring urgency fades. If you are thinking further ahead, I wrote recently about what a housing white paper says about our future buyers, and the long-term demand picture for neighborhoods like ours is a big part of why I do not read this inventory build as a warning sign.
If you are weighing a move in the second half of the year, I am happy to pull the numbers for your specific street and price range. The quarter's story is useful, but your block's story is the one that matters. Reach out any time. You can also read how I work with buyers and sellers across the nine towns this report covers.
This report covers April through June 2026. For whatever the market is doing now, the standing market page stays current.
Henry is a Philadelphia-based REALTOR® serving buyers and sellers in Northwest Philadelphia and Montgomery County, PA. Questions? Get in touch.
Based on information from Bright MLS for 4/1/2026 through 6/30/2026; data is reliable but not guaranteed.
Frequently asked questions
How many homes sold in Northwest Philadelphia in Q2 2026?
435 homes closed across Northwest Philadelphia and the nearby eastern Montgomery County towns between April and June 2026, per Bright MLS, up 46 percent from the 297 closings of the first quarter. Total sales volume reached $241.9 million. Roxborough led the area with 153 closed sales.
What is the median home price in Northwest Philadelphia in 2026?
The median sale price across the nine communities in this report was $437,500 in Q2 2026. It varies widely by neighborhood: East Falls closed at a $371,500 median, Manayunk at $379,900, Roxborough at $399,990, Mt. Airy at $425,000, and Chestnut Hill at $962,500.
Is housing inventory rising in Philadelphia?
Yes. Active listings across the five Northwest Philadelphia zip codes ended June 2026 about 18 percent higher than the prior July, per Bright MLS, with Chestnut Hill nearly doubling. Realtor.com reported the same pattern metro-wide in June: active listings up 13.0 percent year over year and new listings up 9.4 percent.
How fast are homes selling in Northwest Philadelphia?
Fast. Half of the homes that closed in Q2 2026 went under contract within 8 days of listing. The median was 4 days in Wyndmoor, 6 days in Chestnut Hill, Glenside, Flourtown, and Oreland, and 10 days in Roxborough, Mt. Airy, Manayunk, and East Falls.