
The Federal Reserve held its benchmark rate steady on July 29, and mortgage rates rose anyway: Freddie Mac's 30-year average hit 6.66 percent the next morning, up from 6.58 a week earlier. July in Northwest Philadelphia ran on the same kind of contradiction. Closings across the nine communities I cover slowed to 136, per Bright MLS, while the five Philadelphia zip codes put 84 homes under contract, tying the busiest pending month of the past year.
The Fed held, and mortgages got more expensive anyway
The Fed's rate-setting committee voted on July 29 to leave its benchmark at 3.5 to 3.75 percent, where it has sat since January (Federal Reserve). The vote was 9 to 3, and the three dissenters wanted a quarter-point increase, not a cut. Beth Hammack of the Cleveland Fed, Neel Kashkari of the Minneapolis Fed and Lorie Logan of the Dallas Fed all preferred to raise, The New York Times reported.
The direction of those dissents matters. In the June update I passed along that a growing share of traders expected the Fed could raise as soon as July. The raise did not happen, but it came closer than the headline suggests. Inflation has now run above the Fed's 2 percent target for five years, per the Times, and part of the committee wants to act on it.
The bond market read the hold as a risk. The 30-year Treasury yield jumped to 5.22 percent the day of the decision, its highest level since 2007, and the 10-year rose to 4.67 percent, the Times reported. "The market is concerned that the Fed not hiking is going to result in persistently higher inflation," Subadra Rajappa, an interest rate strategist at Société Générale, told the paper.
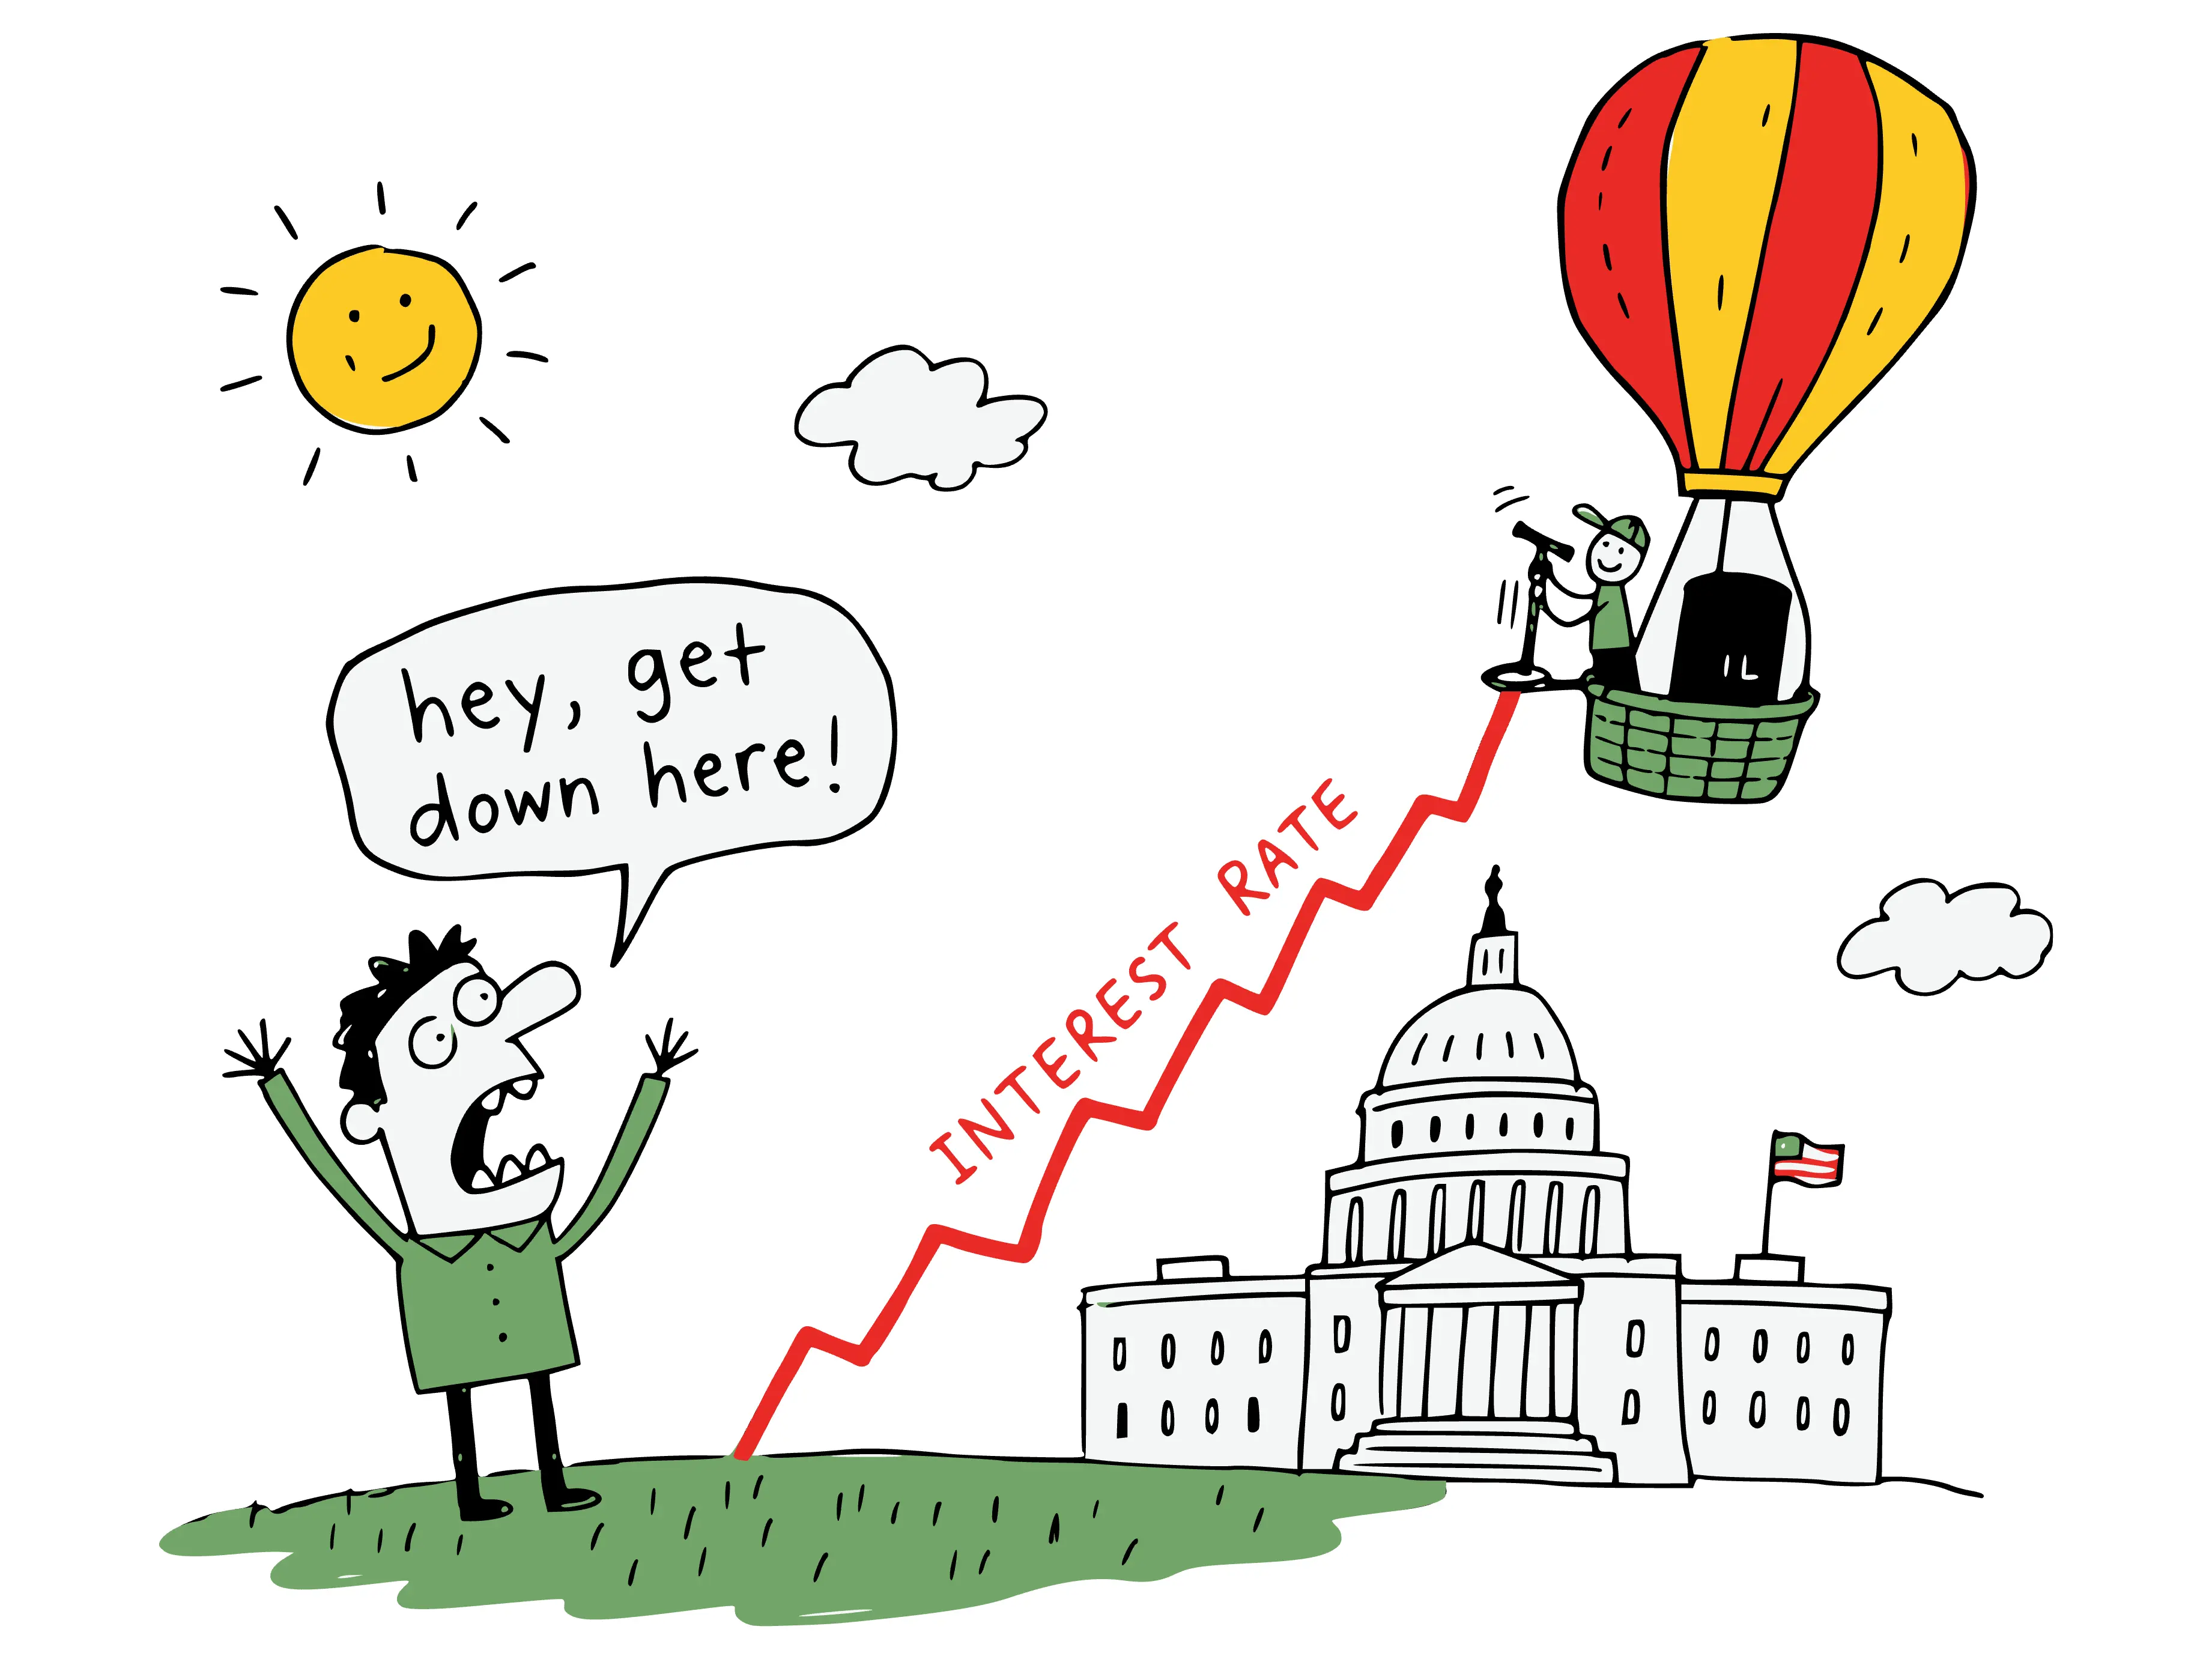
Mortgage rates answer to that 10-year yield, not to the Fed's overnight rate. So the cost of a home loan went up in the same week the Fed did nothing: Freddie Mac's survey put the 30-year fixed at 6.66 percent on July 30, up from 6.58 the week before and still below the 6.72 of a year ago. If you are waiting for the Fed to make your mortgage cheaper, you are watching the wrong number.
Earlier in July I wrote about the market agents keep calling weird, where supply, pace and competition all point in different directions at once. The Fed week was the national version. Nothing moved, and everything did.
July, neighborhood by neighborhood
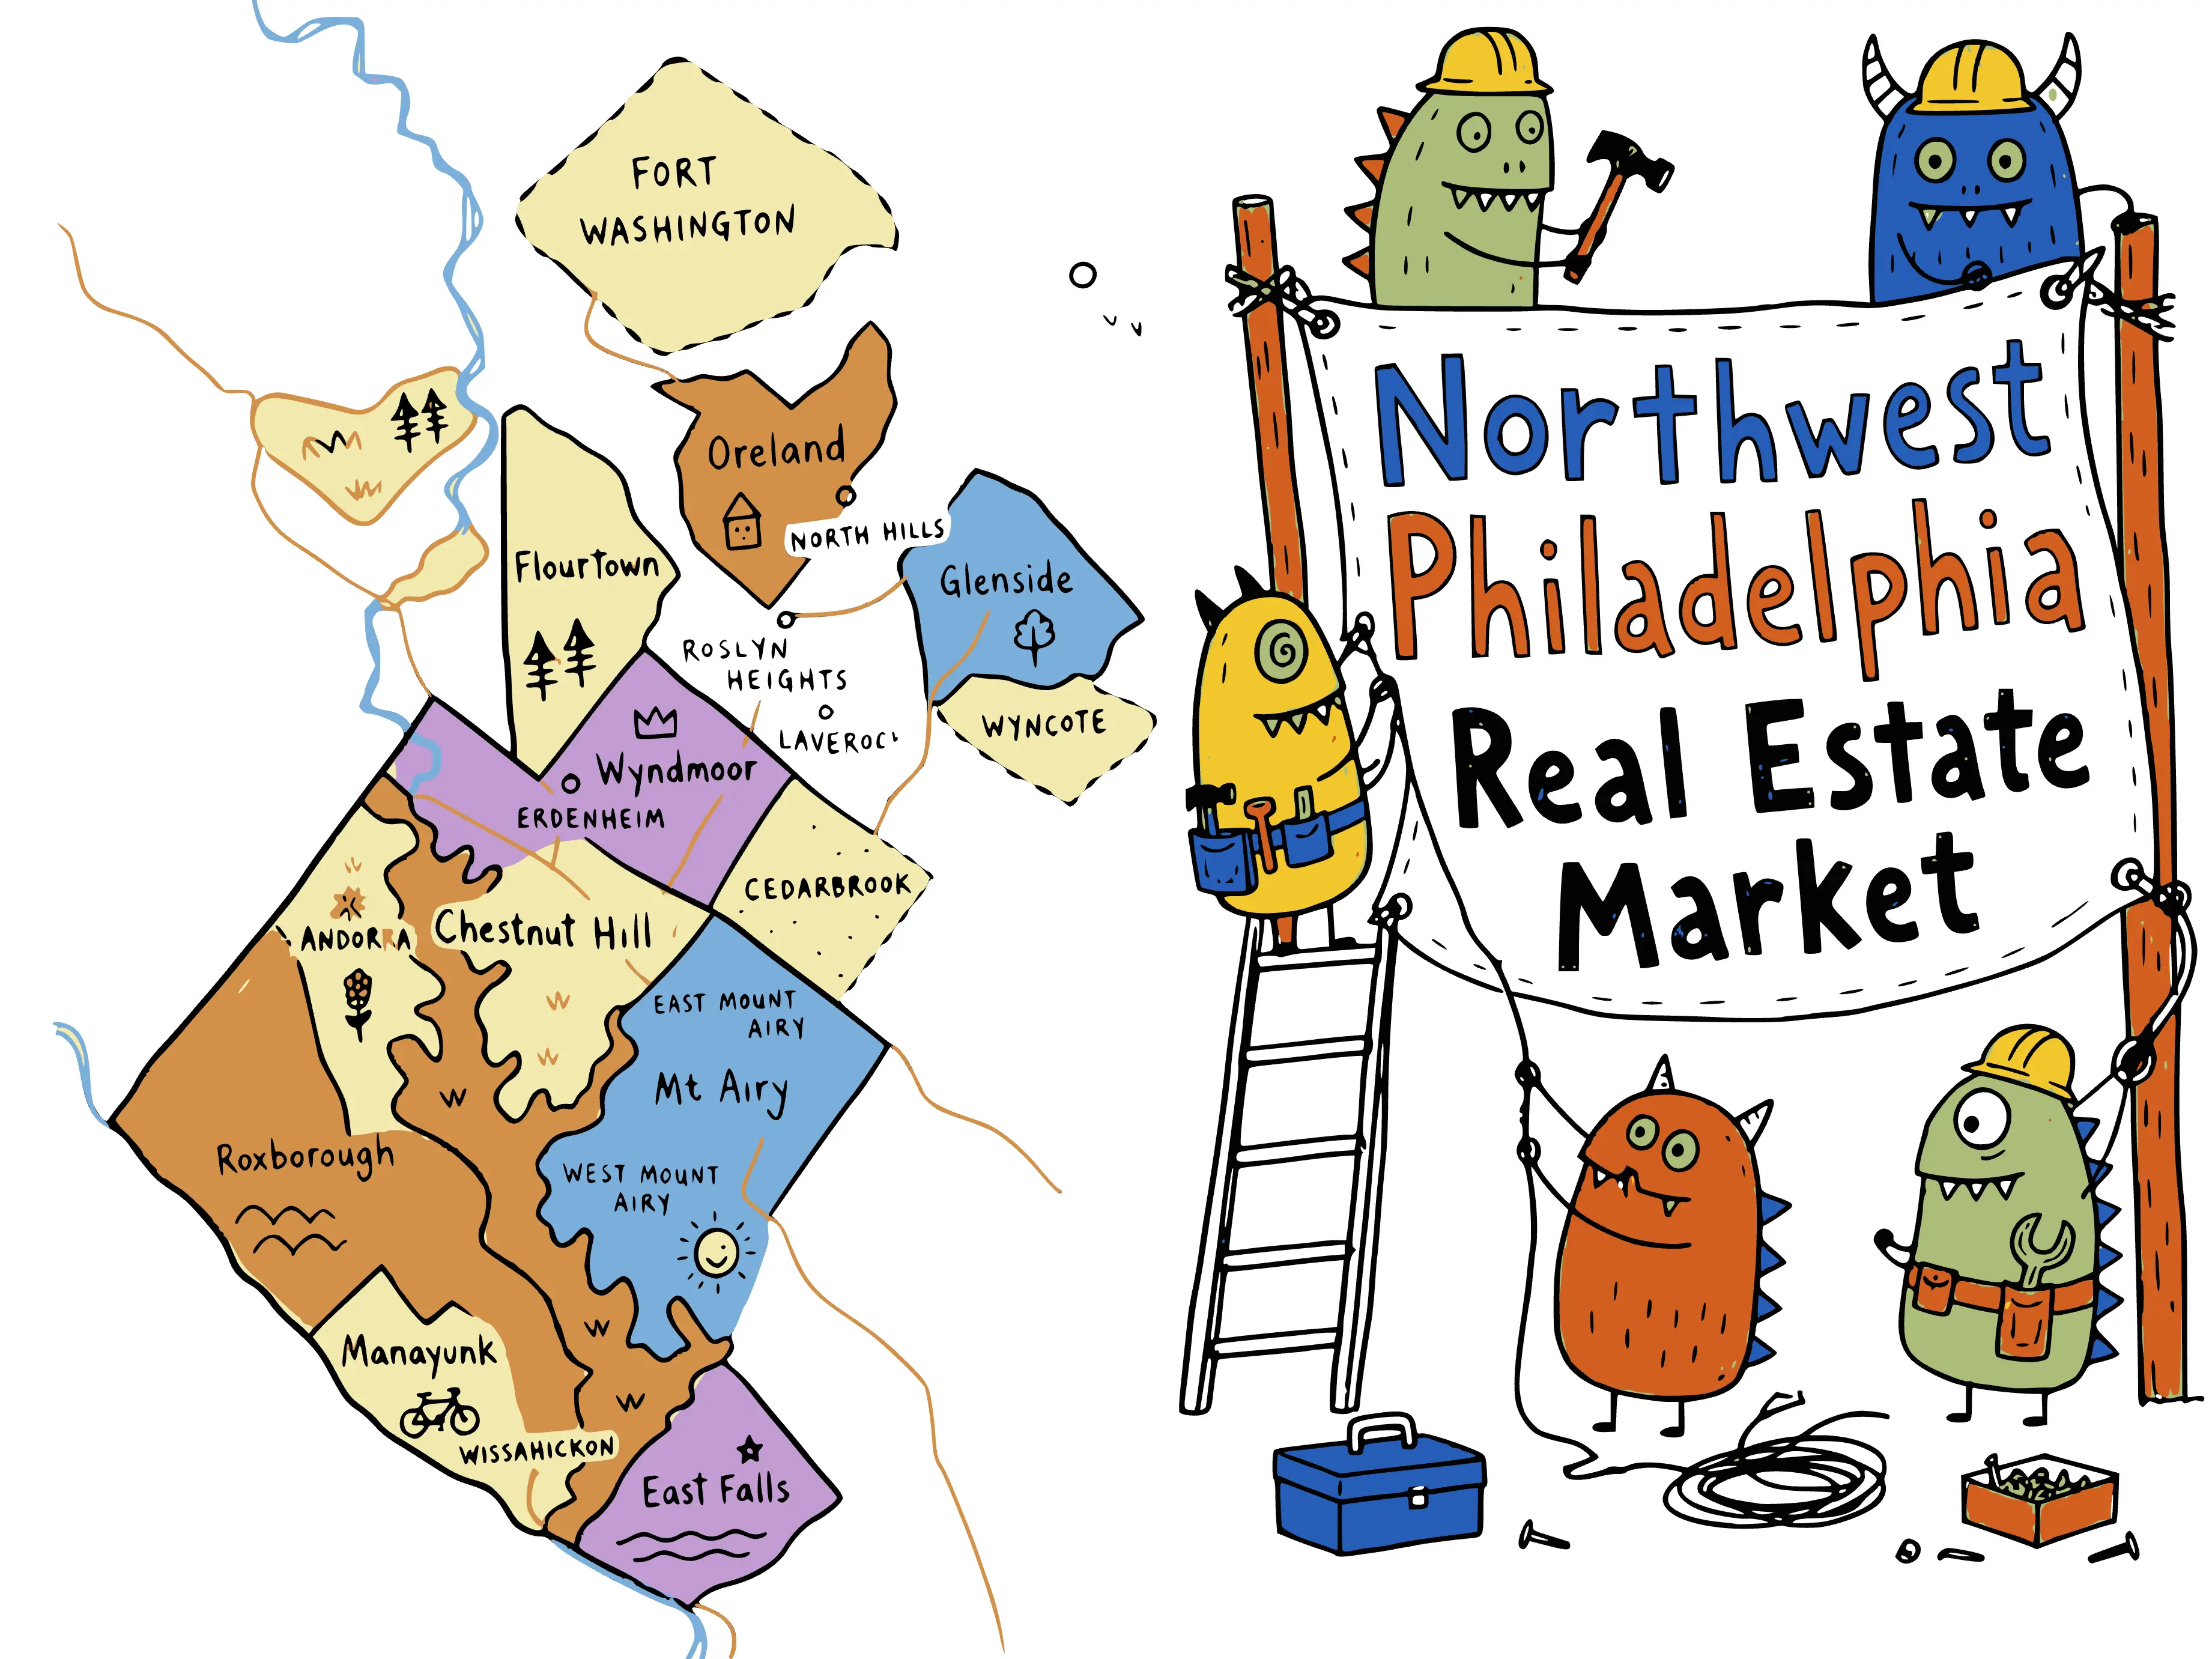
Here is July across the nine communities I work in, from Bright MLS. A reminder on reading small markets: a monthly median moves with the mix of what sold, and in a town with ten closings one unusual sale can move it a lot.
July 2026 closed sales by community
July 1 through July 31, 2026 · Bright MLS residential closings
See the data behind this chart
| Community | Homes closed | Median sale price |
|---|---|---|
| Roxborough | 49 | $385,000 |
| Mt. Airy | 20 | $399,900 |
| Glenside | 19 | $470,000 |
| Manayunk | 12 | $403,145 |
| Chestnut Hill | 11 | $1,250,000 |
| East Falls | 10 | $588,500 |
| Oreland | 9 | $560,000 |
| Flourtown | 4 | $572,500 |
| Wyndmoor | 2 | $975,000 |
The same figures with pace and supply, using each area's average days on market for the city zip codes and the median for the smaller township markets:
- Chestnut Hill (19118): 11 sold, $1,250,000 median, 13-day average, four months of supply
- Mt. Airy (19119): 20 sold, $399,900 median, 59-day average, 3.6 months of supply
- Manayunk (19127): 12 sold, $403,145 median, 29-day average, three months of supply
- Roxborough (19128): 49 sold, $385,000 median, 16-day average, 1.8 months of supply
- East Falls (19129): 10 sold, $588,500 median, 25-day average, 4.6 months of supply
- Glenside (19038): 19 sold, $470,000 median, six-day median time on market
- Oreland (19075): 9 sold, $560,000 median, seven-day median
- Flourtown (19031): 4 sold, $572,500 median, four-day median
- Wyndmoor (19038): 2 sold, at $750,000 and $1,200,000, both under agreement within three days
Roxborough was the month's metronome again: 49 closings, more than double the next busiest community, at a median inside the $355,000-to-$410,000 band it has held all year. Its 16-day average was the fastest of the past 12 months there.
Mt. Airy produced July's strangest pair of numbers. Closings averaged 59 days on market, the slowest month of the past year, while 25 homes went under agreement, the most of any month in the past year. Slow-moving inventory finally cleared while fresh listings sold underneath it. If you want the weird market in two numbers, that is the pair.
Chestnut Hill had a luxury month. Eleven homes closed at a $1,250,000 median, the most closings there since December, and they averaged 13 days on market. The active side of the ledger tells the calmer story: 32 homes for sale at the end of July with an $862,000 median asking price.
East Falls posted a $588,500 median that says less than it seems. Ten homes closed, the mix ran high and the neighborhood's monthly medians have spent most of the past year in the $300,000s. Read it as an unusual month rather than a repricing.
In Montgomery County, Glenside did the volume again: 19 closings, more than Wyndmoor, Flourtown and Oreland combined, with 10 of the 19 selling over asking price. Oreland stretched its usual range with a $935,000 top sale, and Wyndmoor's two July sales both closed over ask.
The pipeline says August is not asleep
Closings describe the past. A sale that closed in July was usually struck in May or June. Pendings describe what August will look like, and July's pendings were loud: the five Philadelphia zip codes put 84 homes under contract, tying October for the most of any month in the past year, with Roxborough (42) and Mt. Airy (25) each setting a 12-month high of their own.
Homes going under contract per month
August 2025 through July 2026 · Bright MLS · tap a legend entry to isolate a neighborhood
See the data behind this chart
| Month | Roxborough | Mt. Airy | Manayunk | East Falls | Chestnut Hill | All five |
|---|---|---|---|---|---|---|
| Aug 2025 | 22 | 19 | 7 | 6 | 6 | 60 |
| Sep 2025 | 32 | 15 | 5 | 7 | 2 | 61 |
| Oct 2025 | 33 | 20 | 9 | 12 | 10 | 84 |
| Nov 2025 | 26 | 13 | 6 | 7 | 6 | 58 |
| Dec 2025 | 15 | 12 | 1 | 3 | 4 | 35 |
| Jan 2026 | 27 | 6 | 7 | 9 | 4 | 53 |
| Feb 2026 | 17 | 7 | 0 | 9 | 5 | 38 |
| Mar 2026 | 28 | 19 | 13 | 7 | 6 | 73 |
| Apr 2026 | 33 | 15 | 7 | 8 | 7 | 70 |
| May 2026 | 31 | 16 | 9 | 10 | 9 | 75 |
| Jun 2026 | 32 | 15 | 8 | 7 | 10 | 72 |
| Jul 2026 | 42 | 25 | 6 | 6 | 5 | 84 |
The metro-wide demand gauge agrees. The T3 Home Demand Index for the Philadelphia metro held at 80 in July, unchanged from June, in a month when the index normally slides toward late summer.
Supply, meanwhile, stopped building. The five zip codes ended July with 319 homes on the market, down from 328 at the end of June and the first month-over-month decline since January. That is still about three months of supply at July's sales pace, ranging from 1.8 months in Roxborough to 4.6 in East Falls, so buyers keep the wider selection the spring delivered.
Active listings at month end
August 2025 through July 2026 · Bright MLS · tap a legend entry to isolate a neighborhood
See the data behind this chart
| Month | Roxborough | Mt. Airy | Manayunk | East Falls | Chestnut Hill | All five |
|---|---|---|---|---|---|---|
| Aug 2025 | 108 | 71 | 37 | 43 | 17 | 276 |
| Sep 2025 | 130 | 78 | 39 | 47 | 25 | 319 |
| Oct 2025 | 135 | 76 | 34 | 47 | 19 | 311 |
| Nov 2025 | 107 | 59 | 28 | 45 | 14 | 253 |
| Dec 2025 | 82 | 52 | 28 | 39 | 12 | 213 |
| Jan 2026 | 79 | 51 | 26 | 34 | 9 | 199 |
| Feb 2026 | 84 | 50 | 35 | 31 | 10 | 210 |
| Mar 2026 | 96 | 52 | 30 | 30 | 14 | 222 |
| Apr 2026 | 110 | 74 | 37 | 36 | 21 | 278 |
| May 2026 | 125 | 79 | 30 | 40 | 29 | 303 |
| Jun 2026 | 129 | 86 | 39 | 39 | 35 | 328 |
| Jul 2026 | 122 | 80 | 39 | 46 | 32 | 319 |
What the quarterly county data shows
Zoom out one level. Bright MLS's Q2 2026 Industry Watch report puts Montgomery County's median sale price at $495,000 on 1.8 months of supply, with sellers collecting 101 percent of the original asking price on average. Philadelphia County's median was $300,000 on 4.3 months of supply, with sellers averaging 96.3 percent of original ask. Montgomery County sellers, in aggregate, are clearing above their asking prices; Philadelphia sellers are settling below theirs.
The zip-level rows sharpen it. Oreland's 19075 collected 105.6 percent of original list in the second quarter, the highest share of any zip I cover, and Glenside's 19038 ran 102.7 percent. Among the Philadelphia zips I cover, only Chestnut Hill's 19118 crossed the asking price, at 103.5 percent.
How to use this in August
For buyers: do not wait on the Fed. The mortgage market has already voted, and it watches the 10-year Treasury, not the committee. If the payment works at 6.66 percent, the more useful lever is negotiation, and price, credits and timelines are negotiable again in the areas carrying three-plus months of supply. A well-priced home still goes in days, so be ready to offer before you tour.
For sellers: the two-speed market has not gone anywhere. July's pendings say the buyers are there; Mt. Airy's 59-day average says mispriced listings are still paying for the wait. Price against the last 90 days of comparable sales, not against the spring.
If you want these numbers run for your block or your price range, reach out. I am happy to pull them. If you are past research and ready to move, the services page shows what working with me looks like on either side of a transaction.
This report is one month in a running series. The standing market page always carries the current numbers, and the Market Update archive holds every dated report.
Henry is a Philadelphia-based REALTOR® serving buyers and sellers in Northwest Philadelphia and Montgomery County, PA. Questions? Get in touch.
Based on information from Bright MLS for 8/1/2025 through 7/31/2026; data is reliable but not guaranteed.
Frequently asked questions
Did the Federal Reserve change interest rates in July 2026?
No. The Fed held its benchmark rate at 3.5 to 3.75 percent on July 29, 2026, the level in place since January. The vote was 9 to 3, and the three dissenters preferred a quarter-point increase, not a cut. Long-term Treasury yields rose after the decision, with the 30-year reaching 5.22 percent, its highest level since 2007, per The New York Times.
What were mortgage rates in July 2026?
Freddie Mac's weekly survey put the average 30-year fixed rate at 6.66 percent on July 30, 2026, up from 6.58 the week before and slightly below the 6.72 of a year earlier. Rates rose after the Fed's July 29 hold because long-term Treasury yields, which mortgage rates track, moved higher on inflation concerns.
How did the Northwest Philadelphia housing market perform in July 2026?
A total of 136 homes closed across the nine communities in this report, per Bright MLS. Roxborough led with 49 closings at a $385,000 median, Mt. Airy closed 20 at $399,900, Glenside 19 at $470,000 and Chestnut Hill 11 at a luxury-heavy $1,250,000. The five Philadelphia zip codes also put 84 homes under contract, tying the busiest pending month of the past year.
Why did mortgage rates rise when the Fed held steady?
Because mortgage rates follow long-term Treasury yields rather than the Fed's overnight rate. After the July 29 hold, the 10-year Treasury yield rose to 4.67 percent and the 30-year to 5.22 percent, its highest since 2007, as investors priced in inflation staying elevated, per The New York Times. Freddie Mac's 30-year mortgage average rose to 6.66 percent the following day.