Mortgage rates crossed 7 percent in the last week of September, the first time since January 2025. For most of the month they were lower, and Northwest Philadelphia buyers signed more contracts than in August. The five Philadelphia zip codes I cover put 78 homes under contract, up from 57, per Bright MLS. Closings across all nine communities fell to 121, and the number of homes for sale reached a 12-month high.
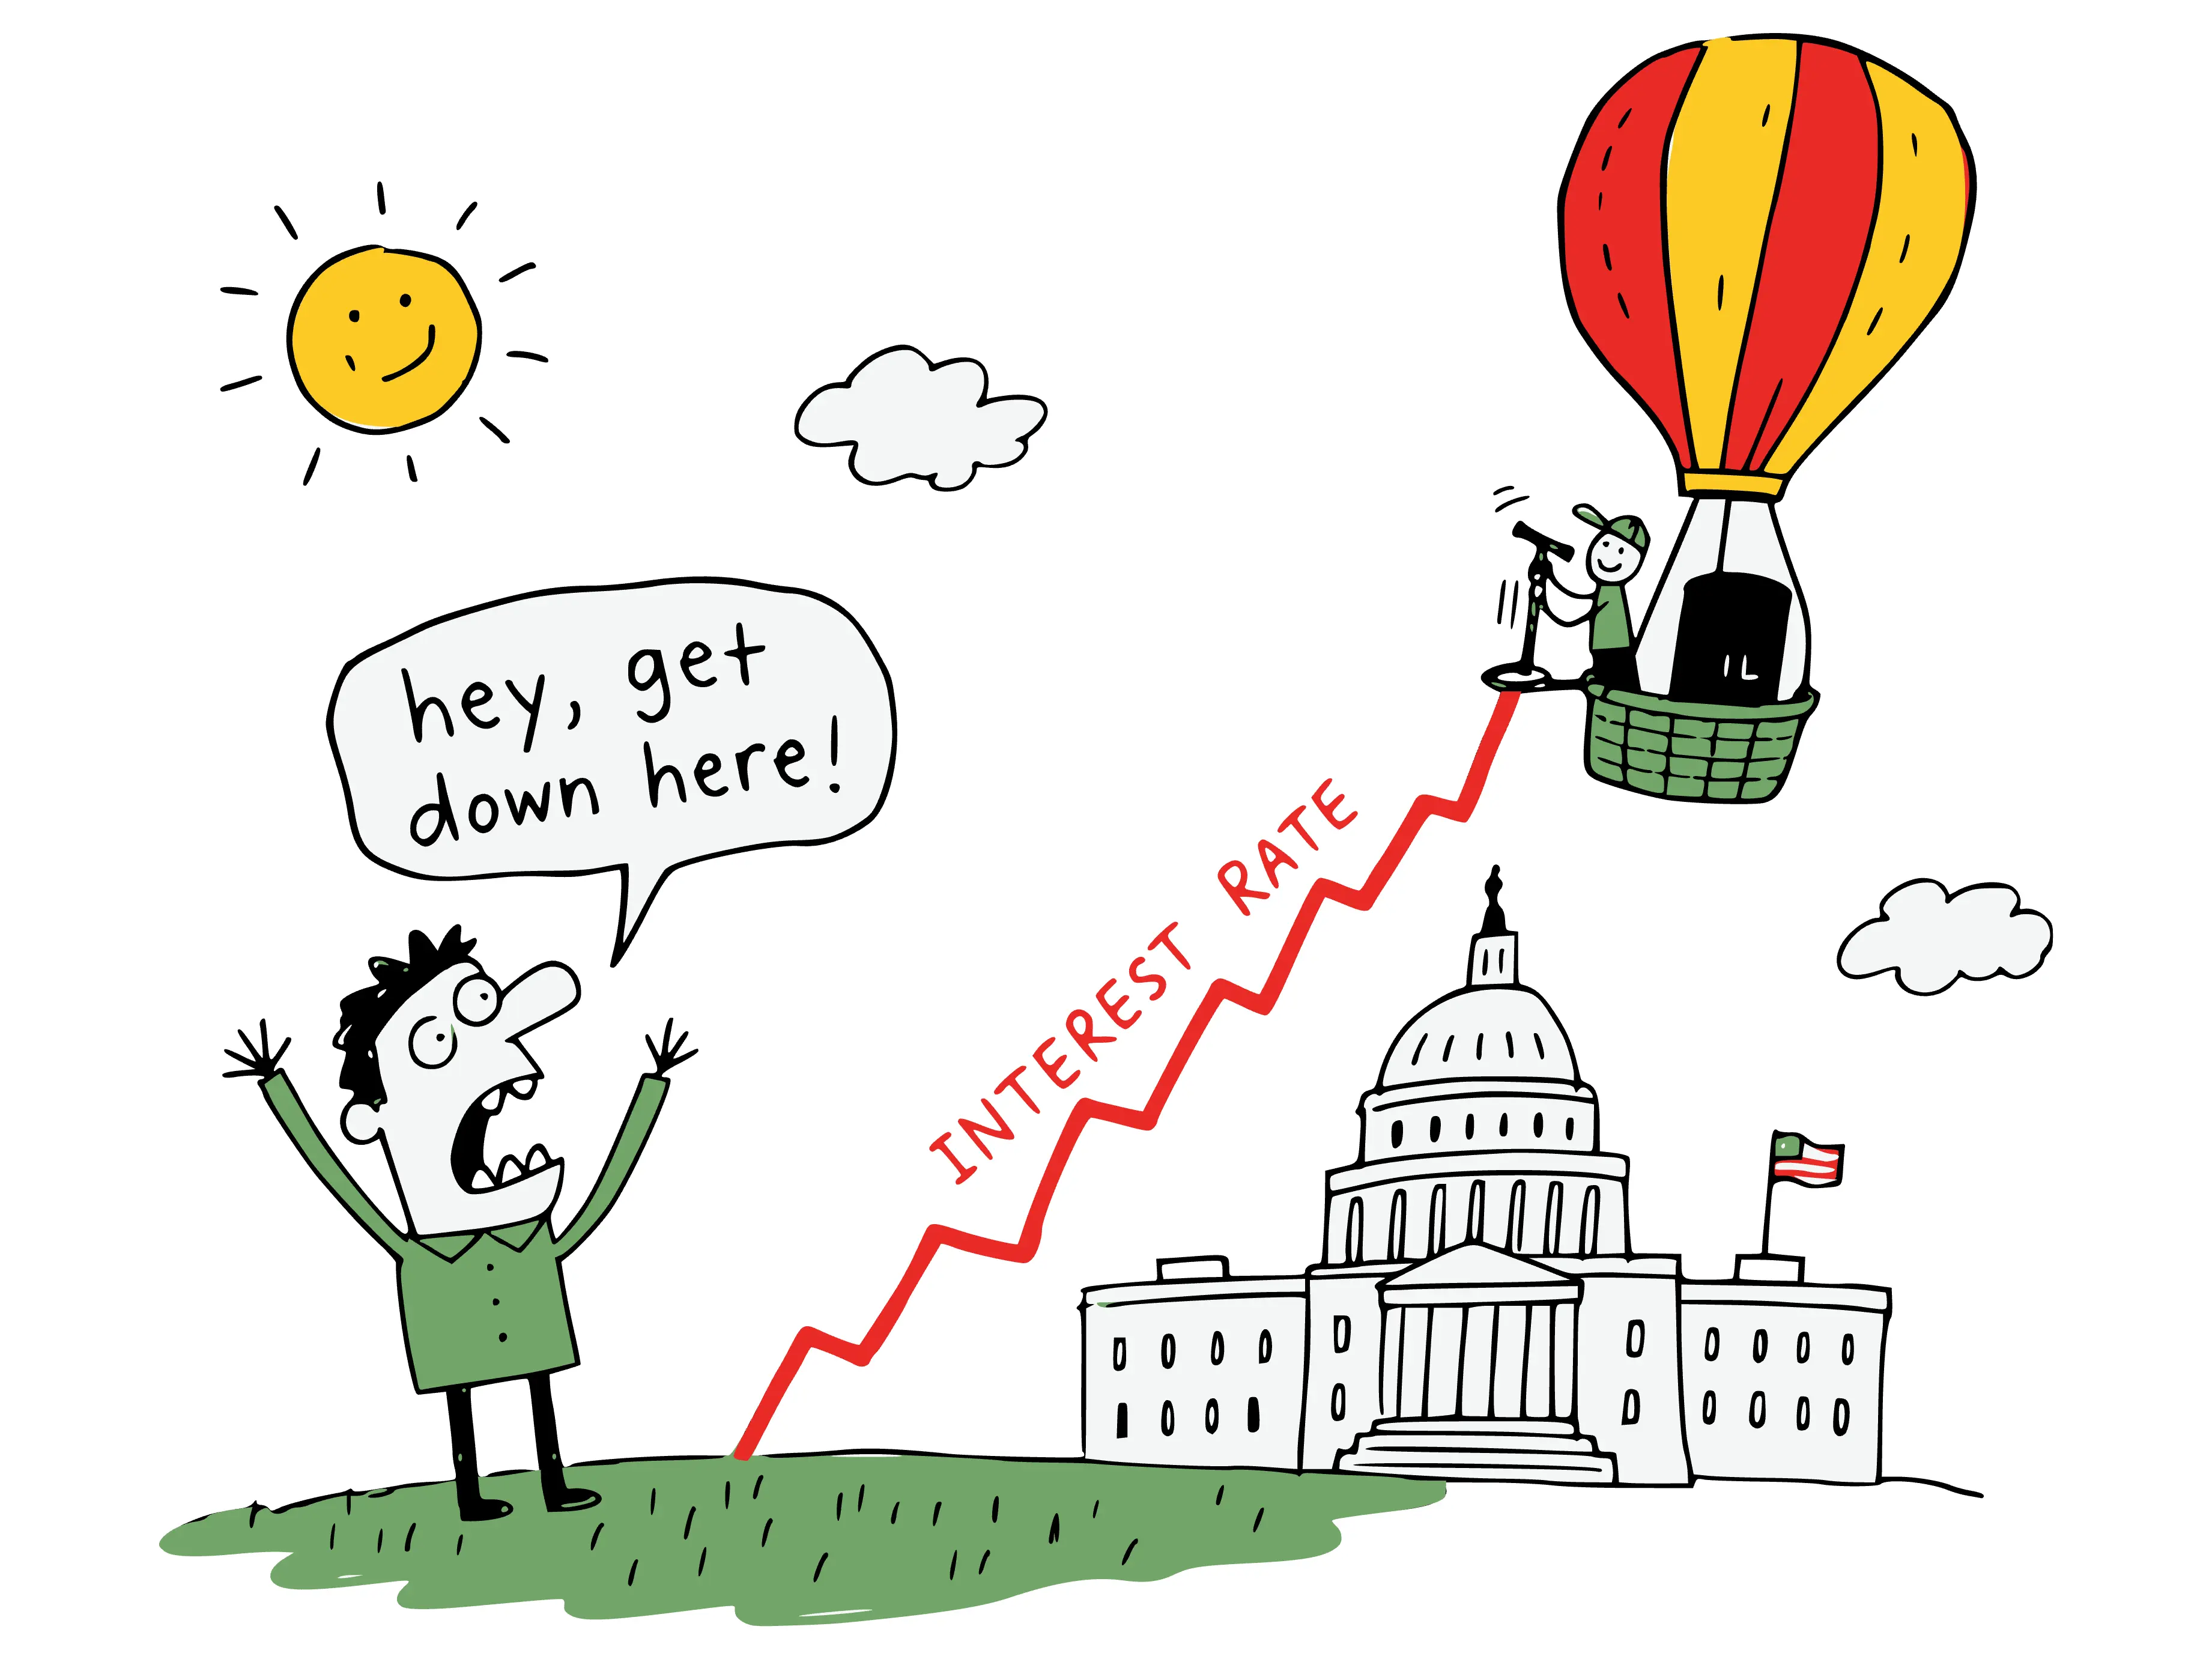
Mortgage rates crossed 7 percent
The Federal Reserve raised its benchmark rate by a quarter point on September 16, to a range of 3.75 to 4 percent, its first increase since July 2023 (Federal Reserve). Mortgage rates had started climbing before the meeting, and they kept going after it.
Freddie Mac's weekly survey put the 30-year fixed at 6.66 percent on August 27, 6.95 on September 17 and 7.03 on September 24. That was the first reading above 7 percent since January 2025. The October 1 survey came in at 7.28, the highest since November 2023. A year earlier, on October 2, 2025, the same survey read 6.34.
Mortgage rates follow the bond market more than the Fed. A 30-year mortgage is priced off the 10-year Treasury yield, and that yield ended September at 5.29 percent, up from 4.75 at the end of August, according to Treasury data published by the St. Louis Fed. I wrote a full breakdown of how that works on the day of the Fed decision.
On a $400,000 loan, principal and interest runs $2,571 a month at 6.66 percent and $2,737 at 7.28 percent. That's $166 more each month for the same loan, or $1,992 a year.
September, neighborhood by neighborhood
A total of 121 homes closed in September across the nine communities I work in, per Bright MLS, down from 138 in August. Those closings mostly reflect contracts signed in July and August, before rates moved. A reminder on reading small markets: a monthly median moves with the mix of what sold, and in a town with a handful of closings one unusual sale can move it a lot.
September 2026 closed sales by community
September 1 through September 30, 2026 · Bright MLS residential closings
See the data behind this chart
| Community | Homes closed | Median sale price |
|---|---|---|
| Roxborough | 39 | $350,000 |
| Mt. Airy | 22 | $482,500 |
| Glenside | 22 | $437,500 |
| Manayunk | 12 | $375,000 |
| East Falls | 10 | $399,900 |
| Chestnut Hill | 6 | $799,500 |
| Flourtown | 6 | $777,750 |
| Wyndmoor | 3 | $465,000 |
| Oreland | 1 | $450,000 |
Wyndmoor's median is the middle of its three sales and Oreland's is its one sale, so neither is a market reading.
Here are the same areas with pace and supply. Days on market is the average for the city zip codes and the median for the smaller township markets. Months of supply is Bright's figure: month-end inventory divided by the prior month's closings.
- Chestnut Hill (19118): 6 sold, $799,500 median, 31-day average, 3.3 months of supply
- Mt. Airy (19119): 22 sold, $482,500 median, 33-day average, 3.4 months of supply
- Manayunk (19127): 12 sold, $375,000 median, 47-day average, four months of supply
- Roxborough (19128): 39 sold, $350,000 median, 23-day average, 3.3 months of supply
- East Falls (19129): 10 sold, $399,900 median, 26-day average, 2.3 months of supply
- Glenside (19038): 22 sold, $437,500 median, 13-day median time on market
- Flourtown (19031): 6 sold, $777,750 median, 66-day median
- Wyndmoor (19038): 3 sold, at $425,000, $465,000 and $1,061,500, all under contract within four days
- Oreland (19075): 1 sold, at $450,000, under contract in three days
Roxborough closed 39 sales, 17 more than any other community, at a $350,000 median. That's the lowest monthly median there in the past year, and it came one month after August's $420,000 set the high. The 12-month band is still only $350,000 to $420,000, so I read both months as mix. September's 23-day average was the second-fastest month of the year.
Mt. Airy's 22 sales closed at a $482,500 median and averaged 33 days on market, down from 40 in August and 63 in July. Half of the 22 went under contract within a week. A few slow listings pull the average up, including one that took 299 days.
Chestnut Hill closed six sales, at a $799,500 median, while new listings picked up. Eighteen homes came to market, up from four in August, and 12 went under contract, the most of any month in the past year.
In East Falls, 10 sales closed at a $399,900 median, the third straight month within $7,500 of $400,000. The average time on market dropped to 26 days from 76, and the slowest of the 10 sales took 55 days.
Manayunk closed 12 sales at a $375,000 median, within $50 of its 12-month median, and ended the month with 40 homes for sale, its highest count of the year.
In Montgomery County, Glenside matched August with 22 closings, at a $437,500 median, per Bright MLS, though the median time on market rose to 13 days from six. Flourtown's six closings were slow ones, with a 66-day median and three of the six listed for 86 days or more. Two of the six were new-construction townhomes on Pennybrook Court. Wyndmoor's three sales all went under contract within four days. Oreland closed one sale, at $450,000.
Contracts rose in September
Closings describe the past. A sale that closed in September was usually struck in July or August. New contracts describe what's coming, and September's rose. The five Philadelphia zip codes put 78 homes under contract, per Bright MLS, up from 57 in August and the third-highest month of the past year. Roxborough accounted for 30 of them, and Chestnut Hill's 12 was its 12-month high.
Homes going under contract per month
October 2025 through September 2026 · Bright MLS · tap a legend entry to isolate a neighborhood
See the data behind this chart
| Month | Roxborough | Mt. Airy | Manayunk | East Falls | Chestnut Hill | All five |
|---|---|---|---|---|---|---|
| Oct 2025 | 33 | 20 | 9 | 12 | 10 | 84 |
| Nov 2025 | 26 | 13 | 6 | 7 | 6 | 58 |
| Dec 2025 | 15 | 12 | 1 | 3 | 4 | 35 |
| Jan 2026 | 27 | 6 | 7 | 9 | 4 | 53 |
| Feb 2026 | 17 | 7 | 0 | 9 | 5 | 38 |
| Mar 2026 | 28 | 19 | 13 | 7 | 6 | 73 |
| Apr 2026 | 33 | 15 | 7 | 8 | 7 | 70 |
| May 2026 | 31 | 16 | 9 | 10 | 8 | 74 |
| Jun 2026 | 32 | 13 | 8 | 7 | 9 | 69 |
| Jul 2026 | 42 | 24 | 6 | 6 | 3 | 81 |
| Aug 2026 | 22 | 17 | 6 | 8 | 4 | 57 |
| Sep 2026 | 30 | 17 | 9 | 10 | 12 | 78 |
Freddie Mac's average stayed below 7 percent until the September 24 survey, so most of those contracts were written before the highest readings. About three-quarters of the September contracts still pending in my Bright MLS export were dated before the 24th.
The metro-wide gauge moved the other way. The T3 Home Demand Index for the Philadelphia metro fell to 77 in September from 82 in August, below its 79 of a year ago. T3 attributed the drop to "rate-and-affordability fatigue" across home types and price tiers.
If rates hold above 7 percent, October will be the first full month there, and its count of new contracts will show how buyers respond.
More homes for sale than at any point in the past year
Sellers kept listing. The five zip codes took 158 new listings in September, per Bright MLS, up from 128 in August and the most since June. New listings ran at about twice the 78 homes that went under contract. The five zip codes ended the month with 333 homes for sale, up from 294 at the end of August and the highest month-end count of the past 12 months. At August's pace of 103 closings, the basis Bright uses, that is about 3.2 months of supply.
Active listings at month end
October 2025 through September 2026 · Bright MLS · tap a legend entry to isolate a neighborhood
See the data behind this chart
| Month | Roxborough | Mt. Airy | Manayunk | East Falls | Chestnut Hill | All five |
|---|---|---|---|---|---|---|
| Oct 2025 | 135 | 76 | 34 | 47 | 19 | 311 |
| Nov 2025 | 107 | 59 | 28 | 45 | 14 | 253 |
| Dec 2025 | 82 | 52 | 28 | 39 | 12 | 213 |
| Jan 2026 | 79 | 51 | 26 | 34 | 9 | 199 |
| Feb 2026 | 84 | 50 | 35 | 31 | 10 | 210 |
| Mar 2026 | 96 | 52 | 30 | 30 | 14 | 222 |
| Apr 2026 | 110 | 74 | 37 | 36 | 21 | 278 |
| May 2026 | 125 | 79 | 30 | 40 | 29 | 303 |
| Jun 2026 | 129 | 86 | 39 | 39 | 35 | 328 |
| Jul 2026 | 122 | 80 | 39 | 46 | 32 | 319 |
| Aug 2026 | 125 | 67 | 39 | 38 | 25 | 294 |
| Sep 2026 | 143 | 79 | 40 | 41 | 30 | 333 |
Roxborough ended September with 143 homes for sale and Manayunk with 40, each a 12-month high. Mt. Airy climbed back to 79 from 67, and Chestnut Hill rose to 30 from 25.
How to use this in October
For buyers: the payment is higher than it was in August, and the selection is wider than it has been all year. Run your numbers at today's rate before you tour, because a preapproval from August would have assumed a rate near 6.66 percent. In four of the five city zip codes (all but East Falls), supply is above three months, which gives a buyer a little more room on price, credits and timelines for homes that have sat. Homes are still going fast, too: half of Mt. Airy's September sales went under contract within a week.
For sellers: you're listing into the most competition of the past year, and into buyers whose payments went up in September. September's count of new contracts was strong, but most of it predates the 7 percent readings. Price against the last 90 days of comparable sales, and expect buyers to weigh your house against more alternatives than at any point in the past year.
If you want these numbers run for your block or your price range, reach out. I'm happy to pull them. And when you're ready to talk about your own move, here's how I work with buyers and sellers.
This report is one month in a running series. The standing market page always carries the current numbers, and the Market Update archive holds every dated report.
Henry is a Philadelphia-based REALTOR® serving buyers and sellers in Northwest Philadelphia and Montgomery County, PA. Questions? Get in touch.
Based on information from Bright MLS for 10/1/2025 through 9/30/2026; data is reliable but not guaranteed.
Frequently asked questions
What were mortgage rates in September 2026?
Freddie Mac's weekly survey put the average 30-year fixed rate at 6.71 percent on September 3, 6.95 on September 17 and 7.03 on September 24, 2026, the first reading above 7 percent since January 2025. The October 1 survey came in at 7.28 percent, the highest since November 2023. A year earlier, on September 25, 2025, the same survey read 6.30 percent.
How did the Northwest Philadelphia housing market perform in September 2026?
A total of 121 homes closed across the nine communities in this report, per Bright MLS, down from 138 in August. Roxborough led with 39 closings at a $350,000 median, Mt. Airy closed 22 at $482,500 and Glenside closed 22 at $437,500. The five Philadelphia zip codes put 78 homes under contract, up from 57 in August, and ended September with 333 homes for sale, the highest month-end count of the past year.
Are there more homes for sale in Northwest Philadelphia than a year ago?
Yes. The five Philadelphia zip codes in this report, 19118, 19119, 19127, 19128 and 19129, ended September 2026 with 333 active listings, per Bright MLS. That is the highest month-end count of the past 12 months and more than the 319 on the market at the end of September 2025. Roxborough's 143 and Manayunk's 40 were each 12-month highs.
How much does a higher mortgage rate change a monthly payment?
On a $400,000 loan with a 30-year fixed rate, principal and interest comes to $2,571 a month at 6.66 percent, the Freddie Mac average on August 27, 2026, and $2,737 at 7.28 percent, the average on October 1. That is $166 more each month for the same loan, before taxes and insurance.