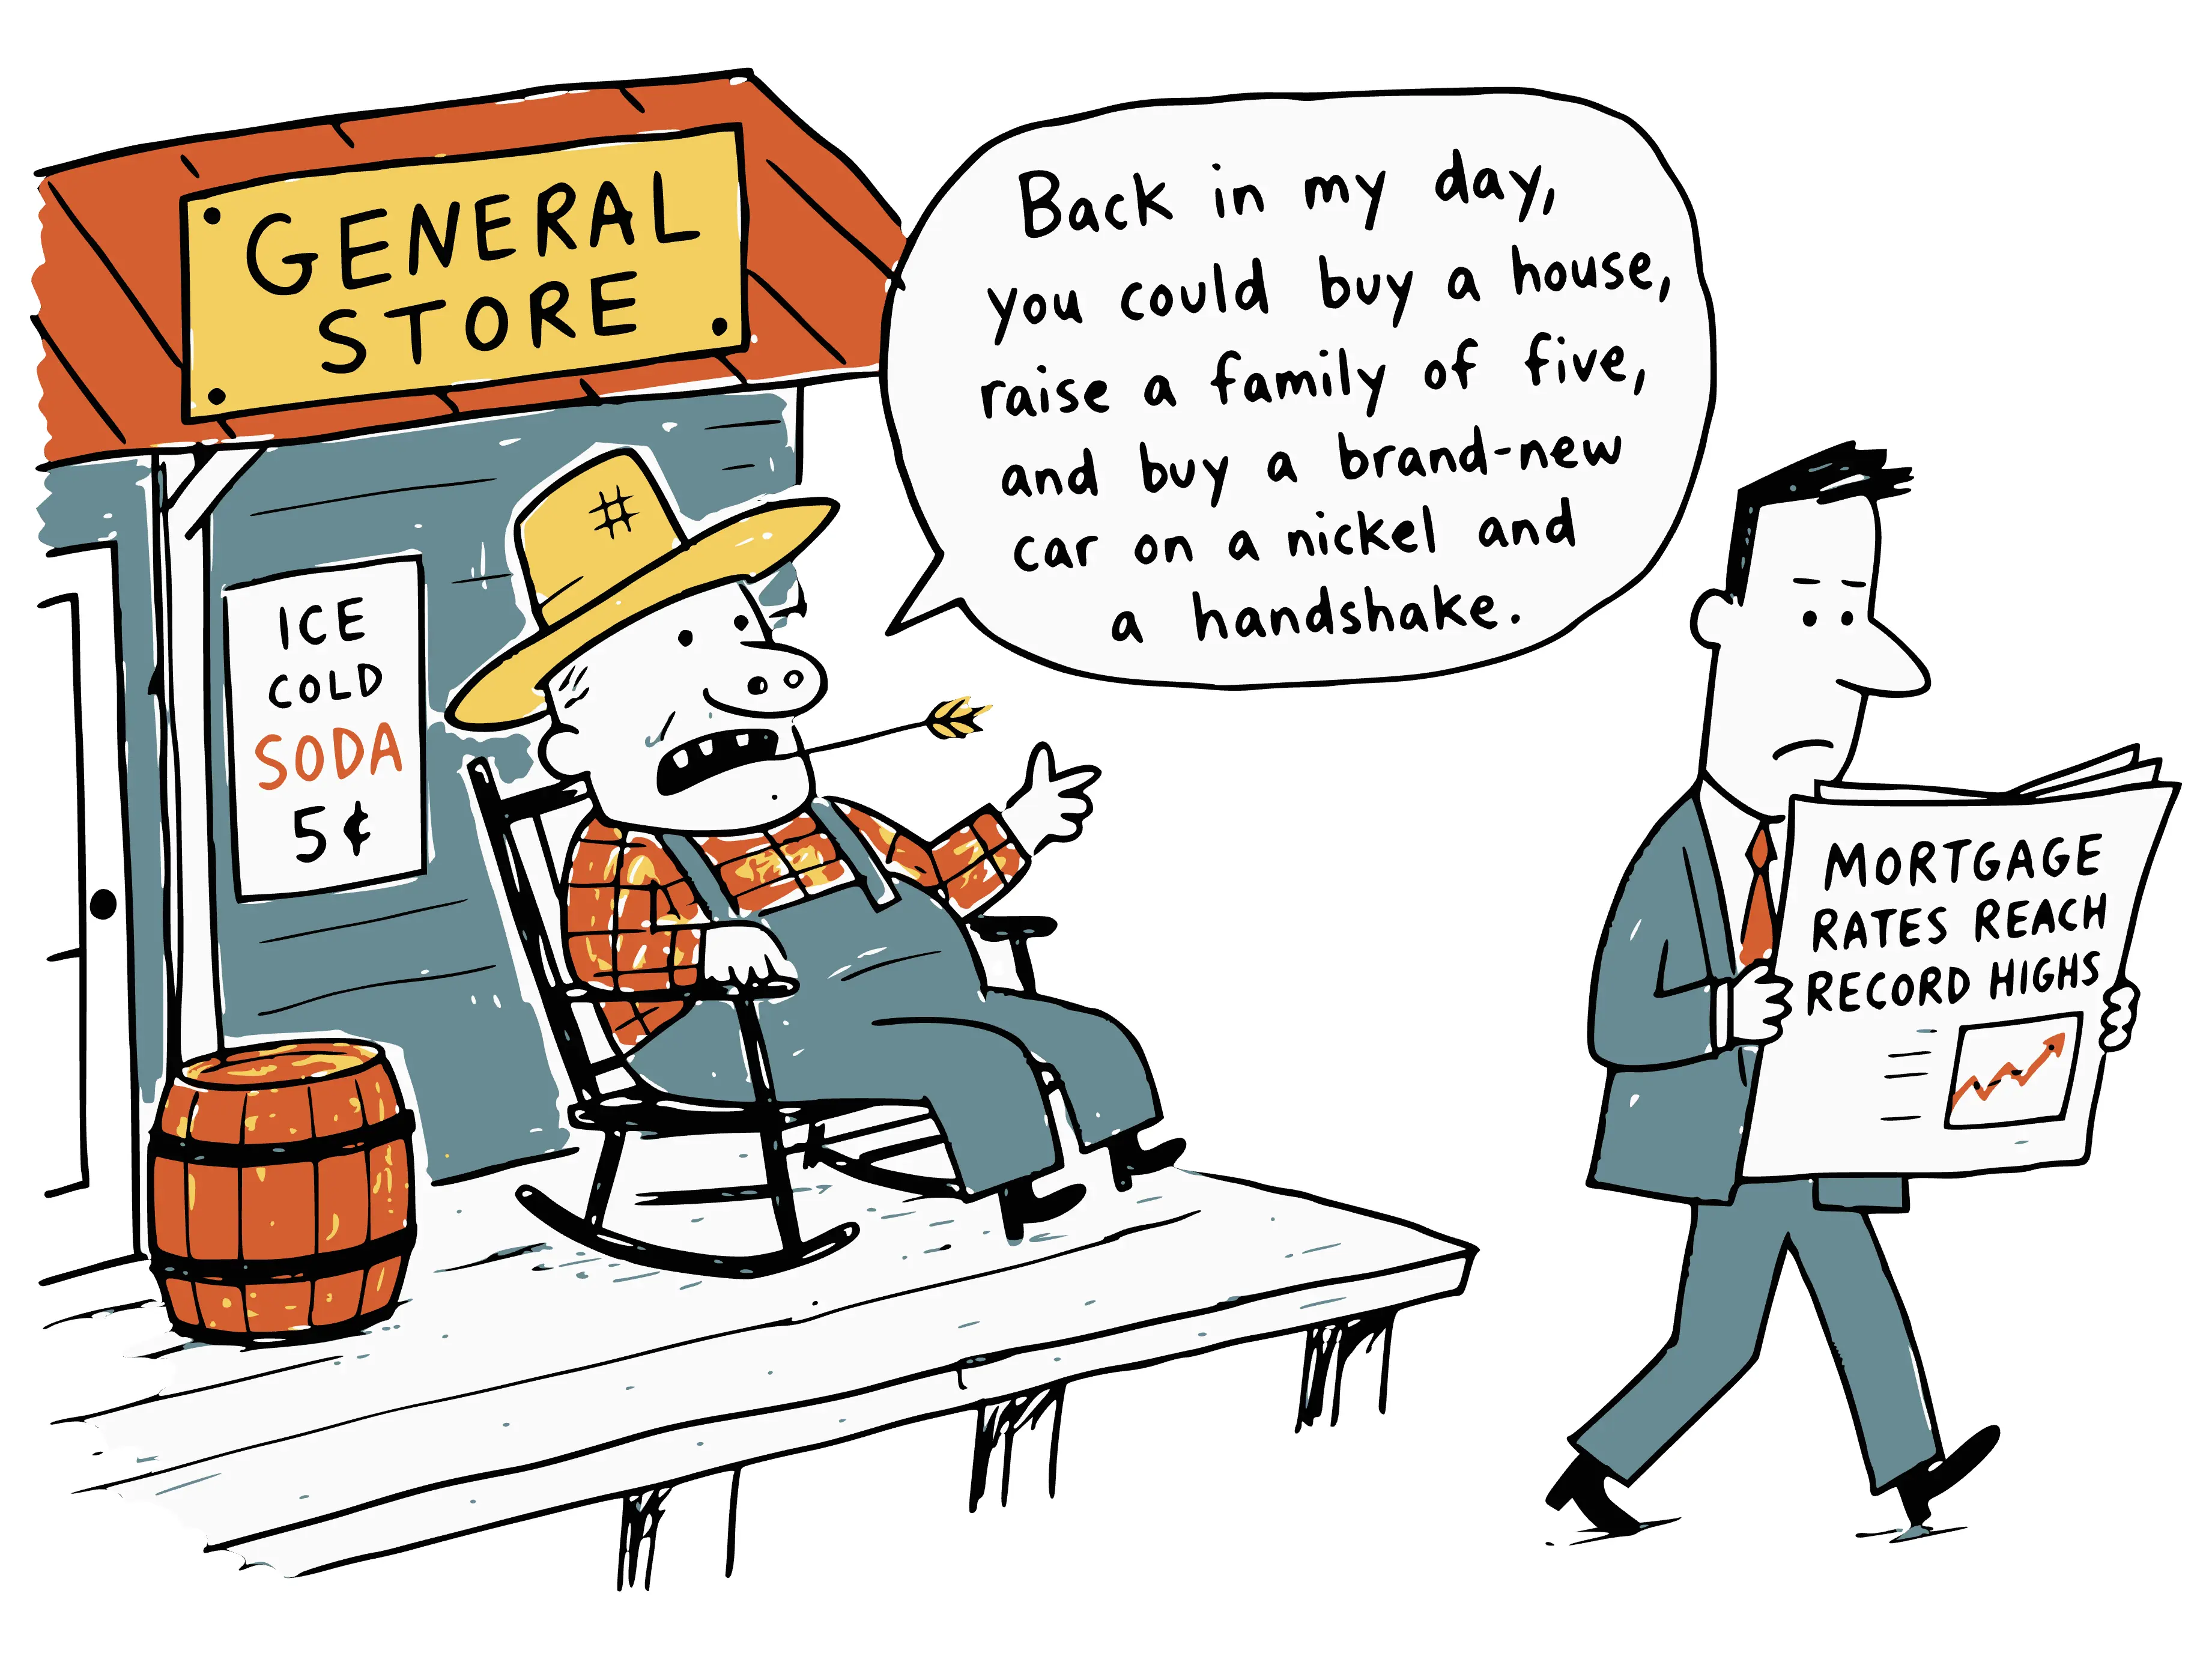
I hear it a lot from older clients and friends: "Rates were 12 percent when we bought!" They're right. Freddie Mac's survey averaged 12.03 percent in July 1985, and today it's 7.28 percent. But the house cost far less. In 1985 the median home was about three years of household income, and today it's almost five. Run both eras through the same math and the monthly payment takes about the same share of income in each. A rate alone leaves out the price of the house and the cash it takes to get in the door.
This week a July 1985 mortgage flyer made the rounds online. It advertised "Rock Bottom Rates" of 11⅞ percent on a 30-year fixed. Mortgage rates in the 1980s really were brutal.
What a rate leaves out
A rate is the price of borrowing money. It says nothing about how much you have to borrow.
In 1985 the median existing home sold for $75,500, according to National Association of REALTORS® figures published by HUD. Median household income that year was $23,620, the Census Bureau reported. So the median home cost about 3.2 years of income.
Today the median existing home sells for $429,100, according to NAR's August 2026 report. Median household income was $87,460 in 2025, the highest on record, the Census Bureau says. That's 4.9 years of income.
| 1985 | 2026 | Change | |
|---|---|---|---|
| Median existing-home price | $75,500 | $429,100 | 5.7× |
| Median household income | $23,620 | $87,460 | 3.7× |
| Home price in years of income | 3.2 years | 4.9 years | +1.7 years |
Prices are NAR medians for existing homes, the 1985 annual figure and the August 2026 figure. Incomes are the Census Bureau's medians for 1985 and for 2025, the latest year published.
Mortgage rates in the 1980s vs. today, side by side
Freddie Mac's weekly survey averaged 12.03 percent for a 30-year fixed in July 1985. On October 1, 2026, it stood at 7.28 percent. The calculator below runs both eras through the same math. Change the down payment or swap the two rates. Or give both eras one rate, and watch what the house price does on its own.
1985 vs. today, run through the same math
Median existing home, median household income, 30-year fixed loan.
| 1985 | Today | |
|---|---|---|
| 30-year fixed rate | 12.03% | 7.28% |
| Median existing-home price | $75,500 | $429,1005.7× since 1985 |
| Median household income | $23,620 | $87,4603.7× since 1985 |
| Home price in years of income | 3.2 years | 4.9 years |
| Down payment20% of the price | $15,100 | $85,820 |
| Down payment in months of income | 7.7 months | 11.8 months |
| Loan amount | $60,400 | $343,280 |
| Monthly principal and interest | $623 | $2,349 |
| Payment as a share of monthly income |
At each era's own rate, the payment takes 31.6% of median income in 1985 and 32.2% today. Nearly a tie. The wider gap is the down payment: 7.7 months of income then and 11.8 months now.
Principal and interest only, before taxes, insurance, mortgage insurance and points. The 1985 rate is Freddie Mac's July 1985 survey average. Today's is the October 1, 2026 reading. Prices are NAR medians for 1985 and August 2026. Incomes are Census Bureau medians for 1985 and 2025, the latest year published. Full sources are at the end of the post.
The folks who say they had it rough are right. In 1985 the rough part was the rate.
Why a rate can come down and a price can't
In 1985 the expensive part was the money, and money got cheaper. In late October 1993, Freddie Mac's survey rate hit 6.74 percent. A 1985 buyer who refinanced then could cut the payment by more than a third. On the $60,400 loan in the table, the payment drops from $623 to $391.
Today the expensive part is the house. If rates fall, a refinance can trim the payment. It can't lower the price you paid, and the loan stays $343,280.
The down payment has grown too. NAR reports the median first-time buyer is now 40, a record, up from the late 20s in the 1980s. Saving the down payment may be part of why. In 1985, 20 percent down on the median home was about 7.7 months of median income. Today it's closer to 11.8 months.
Why national medians only go so far
These are national medians. Philadelphia doesn't move as one market. The math in Mt. Airy isn't the math in Chestnut Hill, and it can change from one block to the next. I'd rather sit down with the comparables for your street than lean on a national average or a flyer from 1985.
If there's a house in Northwest Philly or Montgomery County you keep coming back to, reach out. We'll run the real numbers over coffee. For Chestnut Hill or Glenside, start with how I work with buyers in Chestnut Hill and Glenside.
I'm a REALTOR®, not a lender or an economist. The figures here are national medians as of October 2026. The payments leave out taxes, insurance and mortgage insurance.
Sources: Freddie Mac Primary Mortgage Market Survey, weekly 30-year fixed rates, retrieved October 7, 2026 (July 1985 readings, the October 22, 1993 reading and the October 1, 2026 reading); Freddie Mac, Quarterly Economic Forecast, January 14, 2021, for the 2.65 percent low; U.S. Department of Housing and Urban Development, U.S. Housing Market Conditions, Table 11, Housing Affordability Index: 1971–Present, which publishes the National Association of REALTORS® median existing-home price for 1985; National Association of REALTORS®, Existing-Home Sales Report for August 2026, September 10, 2026; U.S. Census Bureau, Money Income of Households, Families, and Persons in the United States: 1985 (P60-156); U.S. Census Bureau, Income in the United States: 2025 (P60-289), September 15, 2026; National Association of REALTORS®, 2025 Profile of Home Buyers and Sellers, November 4, 2025.
Henry is a Philadelphia-based REALTOR® serving buyers and sellers in Northwest Philadelphia and Montgomery County, PA. Questions? Get in touch.
Frequently asked questions
What were mortgage rates in the 1980s?
Above 10 percent for most of the decade. Freddie Mac's weekly survey of the 30-year fixed rate peaked at 18.63 percent in October 1981. It averaged 12.03 percent in July 1985 and ended 1989 at 9.78 percent. On October 1, 2026, the same survey stood at 7.28 percent.
How much did a house cost in 1985?
The median existing home sold for $75,500 in 1985, according to National Association of REALTORS® figures published by HUD. Median household income that year was $23,620, according to the Census Bureau. So the median home cost about 3.2 years of income. In August 2026 the median existing home sold for $429,100. The 2025 median household income was $87,460. That makes the median home 4.9 years of income.
Was it harder to buy a house in 1985 or today?
The monthly payment is close to a tie. With 20 percent down at each era's own rate, principal and interest took 31.6 percent of median household income in 1985. Today it takes 32.2 percent. The down payment is where today is harder. Twenty percent of the median home was 7.7 months of median income in 1985 and is 11.8 months today. A 1985 buyer could also refinance when rates fell. A high price cannot be refinanced away.
How much have home prices risen compared with incomes since 1985?
The median existing-home price rose from $75,500 in 1985 to $429,100 in August 2026. That is about 5.7 times. Median household income rose from $23,620 in 1985 to $87,460 in 2025, about 3.7 times. Prices grew faster than incomes, so the median home went from 3.2 years of income to 4.9 years.
What is the median age of a first-time home buyer?
Forty, according to the National Association of REALTORS® 2025 Profile of Home Buyers and Sellers, published in November 2025. That is the oldest on record. In the 1980s the median first-time buyer was in their late 20s.